Nahid Negar1, Drew Williams1, Jaclyn Schwartz2, Sheikh Iqbal Ahamed1, and Roger O. Smith2
1Marquette University, 2University of Wisconsin - Milwaukee
ABSTRACT
Adequate environmental lighting is essential for healthy productive living for people with disabilities, making lighting assessment a fundamental component of environmental accessibility evaluations. Unfortunately, many evaluators do not have access to a light meter due to the bulk and cost. Therefore, we sought to create a smart phone based light meter to fill this disparity. The purpose of this paper is to describe the development of the app based light meter, Access Light, and the initial reliability testing.
As direct measurement of light using an iPhone is not possible, we developed and implemented a novel method of measuring light using proxy measures. The camera features, exposure time, ISO value and camera brightness attribute value to be significant predictors of observed lighting levels. When implemented into an app, this algorithm improved the accuracy of our app based light meter compared other apps in the iTunes store, but was less accurate than current light meters.
INTRODUCTION
Persons with disabilities, particularly those with vision loss, are significantly affected by the lighting levels of the environments around them. Specifically, poor lighting is associated with falls, depression, poor visual performance, decreased performance in daily activities, and a lower quality of life (Bakker et al., 2004; Brunnstrom et al., 2004). Because lighting levels have such a profound impact on persons with disabilities, a lighting level assessment is essential during a environmental accessibility evaluation.
Currently, to conduct a lighting assessment, the evaluator must use a physical light meter (Young, 2012). Light meters are a bulky and expensive piece of equipment ranging from about 30 to well over 300 dollars, making it more difficult for a typical practitioner to have a light meter on hand. As part of the Access Ratings for Buildings (AR-B) project, the R&D team has worked to make environmental accessibility evaluation tools more available by duplicating common tools using a smartphone, thereby enabling more people to participate in the building evaluation process (Schwartz, 2013)
Modern smartphone come with many sensors. Using these sensors, the team has successfully measured other building features such as font size & distance (Jahangir, Majumder, Ahamed, & and Smith, 2013). Using the same principals we sought to develop a smartphone based light meter.
Unfortunately evaluating lighting can be very complex. While there are sensors that measure light intensity, apple smartphone products do not have an application programming interface for the light sensor, meaning that more creative methods that utilize other sensors to measure light are needed (Ctein, 1997).
Additionally, measuring light for accessibility purposes also poses some unique challenges. Light intensity can be measured in terms of illuminance and luminance. Luminance measures the brightness value of the reflected lights from an object. Whereas, illuminance considers all possible reflections available in a specific place and calculates the brightness value accordingly. Most light meters apps have been developed for the purposes of photography and therefore measure luminance (Komaee, A., 2010; Das et all., 2011; Jones et al., 1941). Building accessibility evaluations, however, use illuminance measured in foot candles or lux (Bakker et al., 2004). While there is some information on statistical modeling and estimation techniques as well as filtering techniques, little information is available on measuring illuminance as needed accessibility evaluations (Das et all., 2011; Jones et al., 1941). This paper examines a novel technique for measuring the light illuminance and compares it to existing apps and light meters.
TECHNICAL BACKGROUND
Because lighting levels can not be measured directly, we sought to measure light through other sensors that are activated in different lighting conditions. Hue, Saturation, lightness (HSL) is one of the most common cylindrical-coordinate representations of points in an RGB color model. Also known as hue, saturation and brightness (HSB) This model suggests the calculation of the brightness of an image form the RGB values of its pixel (Poynton, 2003; Fulton, 2010). The lightness or the brightness of a pixel is calculated in terms of the luminance value using a linear or nonlinear equation of the RGB value. Coefficients of the RGB values may vary and is usually determined by experimental results. The equations are as following.
Standard Equation
Luminance = (0.2126*R) + (0.7152*G) + (0.0722*B) (1)
Linear equation from the empirical result
Luminance = (0.299*R + 0.587*G + 0.114*B) (2)
Nonlinear equation from the empirical result
Luminance = (0.241*R2+0.691*G2+0.068*B2).5 (3)
 Figure-1 RGB brightness with the Actual Light Intensity
Using one of the above three equations, it is possible to determine the brightness value for a single pixel. To calculate the brightness value of a room or a particular place in a building, an image can be captured and brightness value of each of the pixel can be calculated using one of the above equations. The average value the brightness of each of the pixel can be calculated to obtain the overall brightness of the image. The brightness value of the image should provide the brightness of the specific area of the building for the accessibility measurement. To obtain a more accurate result, a sequence of images can be captured and the average brightness value of these images are used instead. The algorithm is as follows.
Algorithm:
capture series of image_count into images.
total_brightness = 0;
for each image im in images
image_brightness = 0;
 Figure-2 Relative Aperture with the Actual Light Intensity
for each pixel pi in im
image_brightness = image_brightness + Luminance [using equation 1,2,3 ];
end
average_image_brightness = image_brightness/number_of_pixels;
total_brightness = total_brightness + average_image_brightness;
end
brightness_value = total_brightness/image_count;
return brightness_value;
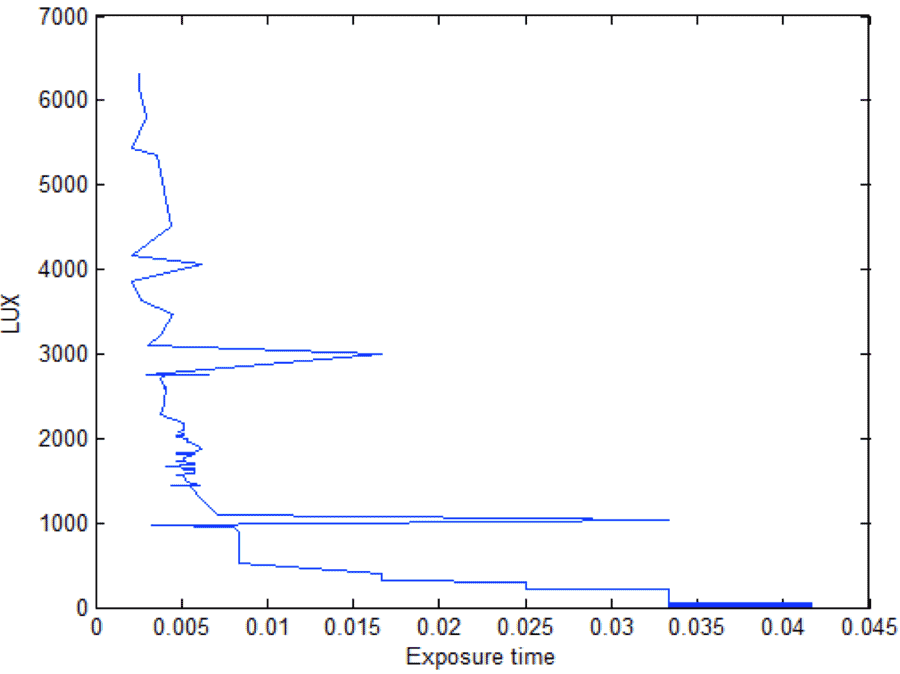 Figure-3 Exposure Time with Actual Light Intensity
We found five different components that may be able to serve as a proxy measures for light illuminance. These proxy measures use the attributes of the camera (Norwood, 1940; ISO 2720:1974). Provided that,
N = Relative aperture (F number)
t = Exposure time
S = ISO speed
L = luminance
K = light meter constant
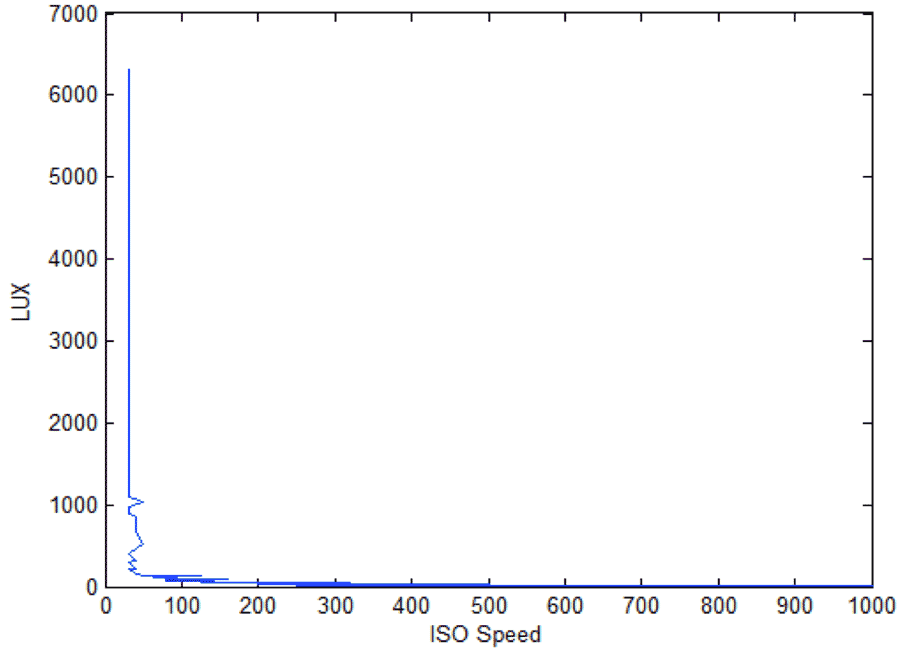 Figure-4 ISO Speed with the Actual Light Intensity
For the reflected light, the below equation (4) represent the relationship between the luminance with the other camera properties.
N2/t = LS/K . (4)
The relationship can be interpreted as following:
- Luminance is directly proportion to the square of relative aperture.
- Luminance is inversely proportioned to the exposure time.
- Luminance is inversely proportioned to the ISO speed
For illuminance the calculation is represented by the below equation:
N2/t = ES/C, (5)
where E = illuminance and C = light meter constant, The relationship with the camera properties remain same for the illuminance.
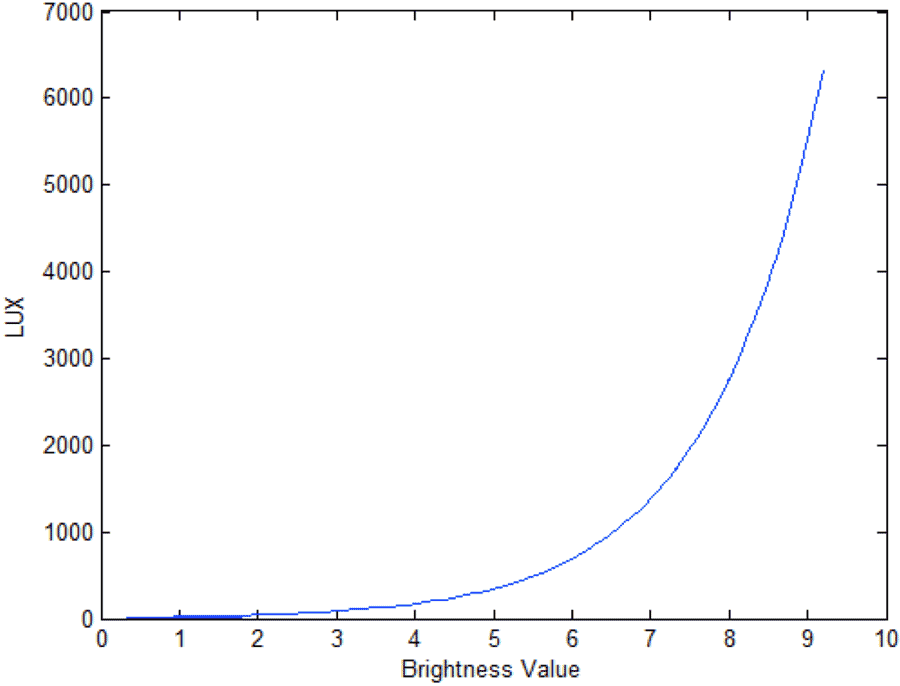 Figure-5 Camera Brightness Value with the Actual Light Intensity.
Other alternative technique is to read the camera brightness value and then establish a relationship with the light intensity in lux which can be represented using the below equation (6) (Lind, 2011).
light intensity in lux = 2BV/0.0929 (6)
App Development
To determine how well the proxy measures of light predict actual illuminance, researchers took measurements of each camera property at different lighting levels. The measured values were processed using the techniques and the formulas described above and plotted in figures 1-5.
Figure-1 shows a random changes in the RGB brightness value as light intensity increases. Conversely, Figure-2 demonstrates that the aperture value remains constant as light intensity increases. The changes in RGB brightness and aperture value indicate that these measures are not to be useful in calculating light intensity. The other three measures, exposure time, ISO value and the camera brightness attribute value all increased as light intensity increased, demonstrating that these values may be helpful in determining true illuminance.
The visual findings were then confirmed by statistical test. We performed a least square regression followed by a statistical t-test to find out the statistical significance of the associated variables. Camera brightness, exposure time, and ISO speed were found to be significant predictors of observed lighting levels.
PROPOSED NOVEL APPROACH
Based on the findings above, the formula for lighting intensity was modified to be as follows:
Light intensity = (K*2BV)/((S/t)*0.0929) (7)
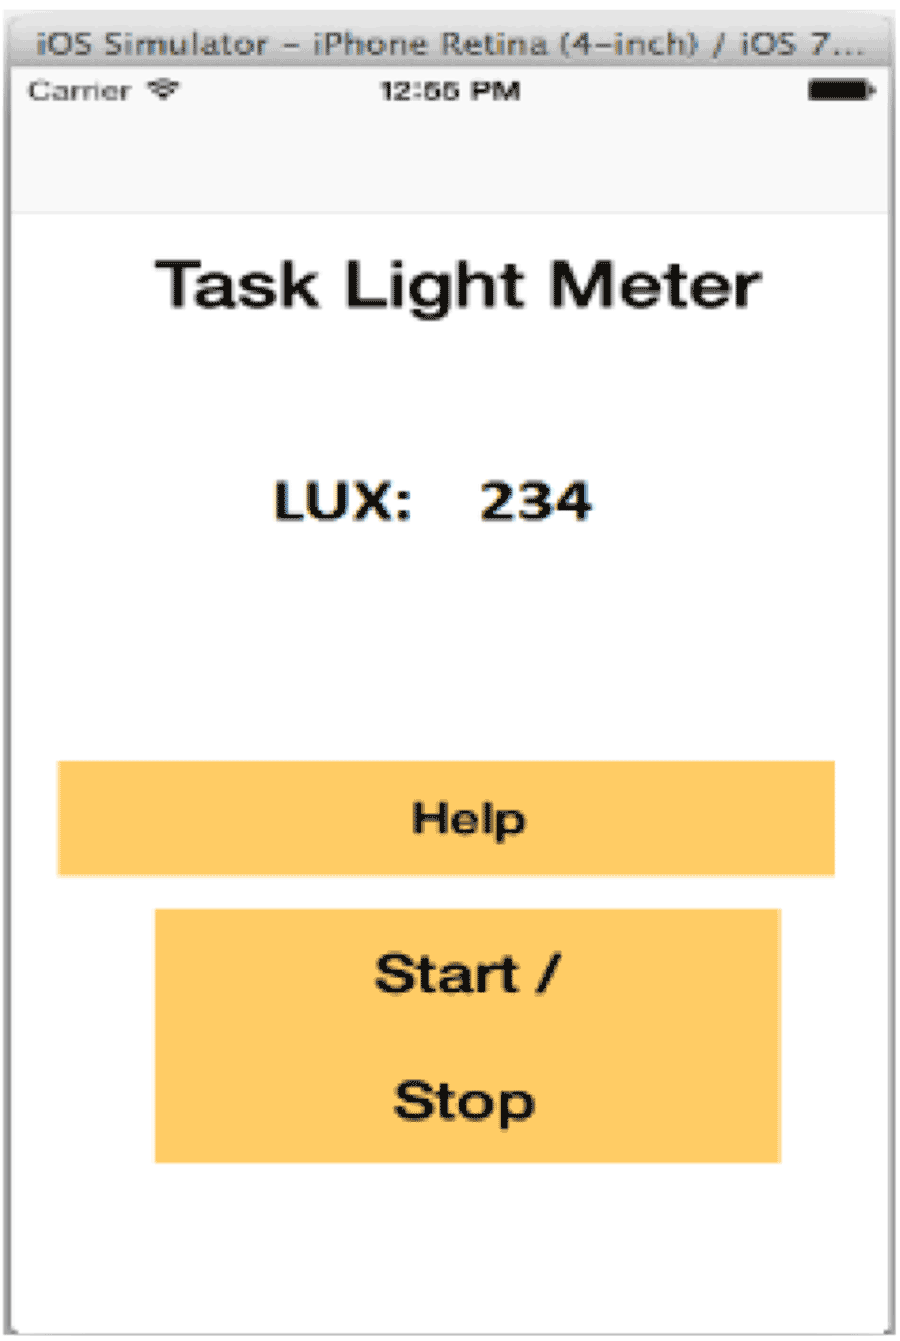 Figure-6 Application User Interface.
From further regression analysis, the value of K is typically found around 750. An algorithm is proposed based on the above equation (7) which is presented below.
Algorithm:
capture series of image_count into images.
total_brightness = 0;
for each image im in images
image_brightness = 750*power(BV,2)/(0.0929*S/t);
total_brightness = total_brightness + image_brightness;
end
brightness_value = total_brightness/image_count;
return brightness_value;
Using the above algorithm, we developed a smart phone application to measure light called Access Light. Access Light is capable of capturing a series of images and perform necessary processing, a screen shot of the alpha version of the app can be seen in Figure 6.
METHODS
Once the application was developed, preliminary testing commenced. We compared Access Light to a light meter and a similar application from the app store. “LightMeter by Whitegoods” was chosen because it is one of the few app available in the iTunes store that measure illuminance and gives readings in lux and foot candles. Researchers also tested Access Light with and without a Luxi,, or a device that attaches to the iPhone to even out light dispersion, allowing for the measurement the light falling on the subject rather than the light reflected by the surrounding. Researchers took five light level readings across ten different lighting situations. The best of the five readings were used. Mean Absolute Percent Error (MAPE) was used to compare overall accuracy. MAPE is the absolute value of the difference between the observed and the actual light intensity over the actual light intensity.
RESULTS
Access Light demonstrates improved accuracy compared to the existing iPhone application for the light meter as seen in Table 1. Use of the Luxi did not show an overall improvement in terms of MAPE. Even though for daylight and fluorescent light Access Light with a Luxi provided the best result, the Luxi did not improve overall accuracy. While the MAPE for Access Light was only 15.8, the tool was off by 0 to 428 lux. As the lighting intensity increased, the accuracy of the tool decreased.
Environment |
Light Meter (Used as Ref.) |
Existing Application |
Our Application |
|
No Luxi |
With Luxi |
|||
Dark |
3 |
2 |
3 |
1 |
Bulb far |
36 |
22 |
28 |
20 |
Bulb obstacle |
18 |
9 |
11 |
7 |
Bulb near |
189 |
110 |
157 |
163 |
Fluorescent far |
246 |
220 |
283 |
261 |
Fluorescent obstacle |
121 |
74 |
152 |
118 |
Fluorescent near |
785 |
659 |
903 |
832 |
Daylight far |
3418 |
4334 |
3187 |
3267 |
Daylight obstacle |
2210 |
2845 |
1984 |
2102 |
Daylight near |
6340 |
11093 |
5912 |
6092 |
Error (MAPE) |
36% |
15.8% |
21.4% |
|
DISCUSSION & CONCLUSION
This paper documents exciting new methods OF measuring illuminance using an iPhone. Exposure time, ISO value and the camera brightness attribute value are all significant predictors of environmental lighting levels. Therefore we developed Access Light to measure light using these proxy measures. While Access Light (using this new algorithm) demonstrates improvements in accuracy compared to other apps in the app store, the tool still lacks the level of accuracy needed for accessibility evaluation. Future research is needed to create more accurate measures of illuminance.
REFERENCES
Ctein. (1997). Post Exposure: Advanced Techniques for the Photographic Printer. Boston: Focal Press. ISBN 0-240-80299-3.
Komaee, A., (March 2010). Maximum likelihood and minimum mean squared error estimations for measurement of light intensity, 44th Annual Conference on Information Sciences and Systems (CISS), 2010, vol., no., pp.1,6, 17-19.
Das, S.R.; Chita, S.; Peterson, N.; Shirazi, B.; Bhadkamkar, M., (March 2011) "Home automation and security for mobile devices," Pervasive Computing and Communications Workshops (PERCOM Workshops), 2011 IEEE International Conference on , vol., no., pp.141,146, 21-25.
Jones, Loyd A., and H. R. Condit. (1941) The Brightness Scale of Exterior Scenes and the Correct Computation of Photographic Exposure. Journal of the Optical Society of America. 31:651–678.
Norwood, Donald W. (filed 14 November 1938, and issued 10 September 1940). Exposure Meter. US Patent 2,214,283.
ISO 2720:1974. General Purpose Photographic Exposure Meters (Photoelectric Type) — Guide to Product Specification. International Organization for Standardization.
James. Luxi, Incident light meter adapter for iPhone. Retrieved from: http://www.kickstarter.com/projects/jamesflynn/ luxi-incident-light-meter-adapter-for-iphone
Whitegood, iPhone-based light meter application. Retrieved from: https://itunes.apple.com/us/app/ lightmeter-by-whitegoods/id501638921?mt=8
Charles Poynton. (2003). YUV and luminance considered harmful. Retrieved from: http://poynton.com/ papers/ YUV_and_luminance_ harmful.html
Wayne Fulton. (2010). A few scanning tips, a little bit more about histogram. Available: http://www.scantips.com/lumin.html
John. A. Lind. (2001). Foot candles and Lux. Retrieved from: http://johnlind.tripod.com/science/ scienceexposure.html
Bakker, R., Iofel, Y., & Lachs, M. S. (2004). Lighting Levels in the Dwellings of Homebound Older Adults. Journal of Housing for the Elderly, 18(2), 17-27.
Brunnstrom, G., Sorensen, S., Alsterstad, K., Sjostrand, J., Brunnstrom, G., Sorensen, S., . . . Sjostrand, J. (2004). Quality of light and quality of life--the effect of lighting adaptation among people with low vision. Ophthalmic & Physiological Optics, 24(4), 274-280.
Jahangir, A. K. M., Majumder, A., Ahamed, S. A., & and Smith, R. O. (2013). iDistanceM: A Real-time Smartphone-based Distance Measurement for the Americans with Disabilities Act Compliance Assessment Tool (ADACAT). Paper presented at the Rehabilitation Engineering and Assistive Technology Society of North America 2013 Conference, Bellevue, Washington, USA.
Schwartz, J., O'Brien, C., Edyburn, K., Ahamed, S.I., Smith, R.O.,. (2013). Smartphone based solutions to measure the built environment and enable participation Paper presented at the Rehabilitation Engineering and Assistive Technology Society of North America 2013 Conference, Bellevue, Washington, USA.
Young, D. (2012). Light the Way: Providing Effective Home Modifications for Clients with Low Vision. OT Practice, 17, 8-12.
ACKNOWLEDGEMENTS
The AR-B Project is supported in part by the Department of Education, National Institute on Disability and Rehabilitation Research (NIDRR), grant number H133G100211. The opinions contained in this proceeding do not necessarily represent the policy of the U.S. Department of Education, and you should not assume endorsement by the Federal Government.
Audio Version PDF Version