Dennis B. Tomashek1, Roger O. Smith1, Jaclyn Schwartz1, Sheikh Iqbal Ahamed2
1University of Wisconsin-Milwaukee, 2Marquette Universityabstract
Sloping ground, found in routes and ramps, can be difficult to maneuver in a wheelchair, causing both chronic and acute injury in wheelchair users. There is a need for tools that are quick, convenient, and accurate to help document environmental barriers and advocate for more accessible spaces. Currently, many level-type apps exist; however, none are designed specifically for accessibility documentation. The Access Slope Mini-Tool (ASMT) mobile app is designed to not only measure the slope of a ramp, but also guide the user through the process of conducting a thorough assessment of accessibility, and let the user know immediately whether the ramp is accessible or not. The ASMT is designed to work either as a stand-alone tool, or to be integrated as part of the NIDRR funded Access Ratings for Building (AR-B) suite of accessibility tools. This study examined the concurrent validity and instrumental reliability of the ASMT by comparing it to the gold standard of a 4 foot level. Results show good concurrent validity for the ASMT compared to a 4 foot level, and excellent intra-instrumental reliability for the ASMT on both an iPod® and an iPad®.
BACKGROUNd
Approximately 1.6 million non-institutionalized Americans use wheelchairs to facilitate their day-to-day functional mobility (Kaye, Kang, & LaPlante, 2002). In 2003 alone, more than 100,000 wheelchair users were treated in U.S. emergency rooms, with the leading cause of injury being wheelchair tips and falls (Xiang, Chany, & Smith, 2006).
Wheelchair tips and falls can happen for a variety of reasons, but are often induced by architectural features. Gall and colleagues (1997) found that 79% of tips and falls often occurred on non-level ground indicating that sloping surfaces can present a hazard to wheelchair users (Gaal, Rebholtz, Hotchkiss, & Pfaelzer, 1997). In addition to acute injury, sloping surfaces can also increase the amount of force needed to propel a wheelchair forward, contributing to chronic conditions such as shoulder injury (Brubaker, McLAURIN, & McCLAY, 1986).
Because sloping surfaces present such a danger to wheelchair users, the slope of the ground in public spaces is regulated by the Americans with Disabilities Act Accessibility Guidelines (ADAAG) (U.S. Architectural and Transporation Barriers Compliance Board, 1990). The ADAAG outlines architectural guidelines for both cross slope and running slope on the accessible route as well as ramps. The running slope describes how slanted a surface is in the direction of travel, while cross slope describes how slanted a surface in perpendicular to the direction of travel (Osterberg, 2010). Specifically, the running slope of an accessible route should have a running slope of less than 5% and a cross slope of less than 2%, while ramps should typically have a running slope of less that 8.3% and a cross slope of 2%(Osterberg, 2010).
While the ADAAG has been in place for over two decades, many public buildings do not meet the guidelines meaning that many wheelchair users continue to face architectural barriers causing both decreased community participation and increased rates of injury(McClain, 2000).To improve community participation and prevent tips and falls advocates must encourage building owners to create more safe and accessible spaces.
Development of the Access Slope Mini-Tool app
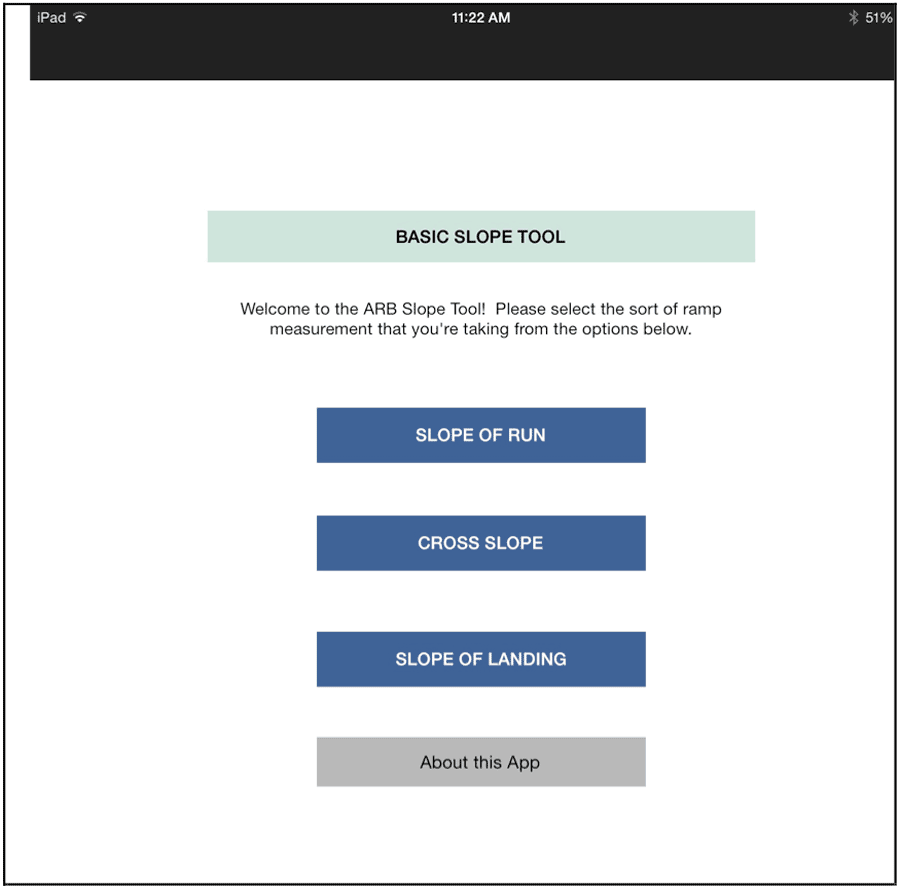 Figure 1. Screenshot of the Access Slope Mini-Tool Mobile app opening screen.
The purpose of developing the ASMT was two-fold. First, while many level-type apps exist for both iOS and Android systems, none are specifically designed for determining accessibility. The ASMT was developed so that each necessary measurement for determining accessibility has a discrete button for the ramp slope, cross slope, and slope of the landing. Each measurement, taken in degrees is saved so that the user can view past measurements. The measurement is also converted to percent and a height to vertical ratio, and a rating is given, from poor to good.
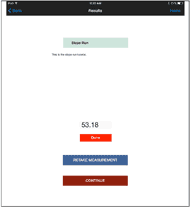 Figure 2. Screenshot of the Access Slope Mini-Tool Mobile app data collection screen.
The second purpose of developing our own slope tool was that the data can then be integrated into the AR-B accessibility suite, which can be used by a trained rater to rate the accessibility of an entire building, from parking lot to entrances, doors, stairs, bathrooms, etc. The current existing apps may or may not be accurate, but more importantly, they do not have a way to store data or integrate it into our system.
Thus, the purpose of this study was to conduct preliminary concurrent validity and the reliability of the instrument to accurately measure the slope of a ramp. Version 0.9 for iOS 7 was tested both on an iPad® and an iPod® Touch. To act as a gold standard a 4 foot digital readout level was used and a 2 foot digital readout level was also used as this is indicated as the standard in the ADA Best Practices tool Kit for state and Local Governments (2009). Both are made by Kapro®.
We expected that the 4 foot level and the 2 foot level would near perfect internal consistency. We also expected some variability for the iPod® and iPad®, due to their smaller size, which may not be as well equipped to compensate for minor dips or rises in a ramp.
Methods
To test the Concurrent validity of the ASMT, four instruments were used. Because the ASMT is designed to be used on multiple device types, version 0.9 was used on both an iPad® and iPod®.
Implementation Protocol
In order to ensure that the measurements were taken in a consistent manner, a detailed protocol was developed and implemented.
An example from the protocol:
RUN SLOPE
Make sure to use the SLOPE OF RUN button. Three measurements with each device will be taken every 4ft of the ramp until a landing is reached. Because the middle of each device, including the levels, needs to be placed at the same spot, measurement will start at the 2ft mark. A piece of chalk will be provided to mark the location to ensure that the middle of each device is placed at the exact same location. The top of the device (phone or tablet) should face toward the top of the ramp.
To begin measurement, lay the device or level flat on the surface of the ramp.
For the devices:
- Touch the green start button. It will immediately turn yellow, and say “in progress”.
- Touch the button again, and it will turn red and say “done”
- Enter the number. To remeasure at the same point, hit the Retake measurement button, and repeat steps 1 through 3.
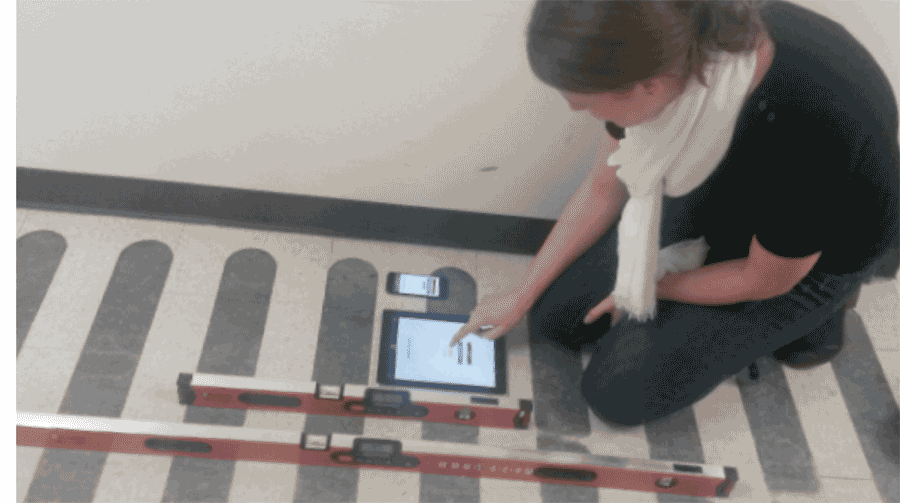 Figure 3. Testing the AR-B Access Slope Mini-tool app.
Similar procedures were conducted for the cross slope, but with the instruments perpendicular to the ramp rise, and the bottom and top landings.
All ramps were located on the UWM campus, and included both interior and exterior locations. Eight ramps, with 1, 2, or 3 runs were measured, for a total of 48 measurements with each instrument. Due to the limited space, only the results of the ramp slopes are reported in this paper, although cross slope and slope of landings was also measured.
Data Analysis
To compare the results of the four instruments, a repeated measure ANOVA was conducted. In order to compare each individual instrument to the gold standard (the 4 foot level) a priori simple contrasts were conducted, using the 4 foot level as the comparison variable. To measure the instrument reliability, a 2-way random model for consistency reliability analysis was conducted between the four instruments (inter-instrument). For internal consistency (intra-instrument), a 2-way mixed model was conducted. The Intraclass Correlation Coefficient (ICC) Average Measures are reported below. All analysis was conducted using SPSS 21.
Results
Concurrent Validity
The results of the repeated-measures ANOVA were significant (p=.000). The a priori contrasts comparing each instrument to the 4 foot level found that both the iPod® (p=.020) and iPad® (p. =.000) were significantly different, but the 2 foot level was not.
iPod® |
-.189 (.291) |
iPad® |
-0,851 (.298) |
2 foot Level |
0.073 (.269) |
Inter- and Intra-instrument reliability
The ICC for the inter-instrument reliability was .873 (95% CI; .727-.950).
For the 2 foot and 4 foot levels, the intra-instrument ICC was 1.000, indicating perfect consistency. For the iPod®, the ICC was .995, and for the iPad®, the ICC was .996.
discussion
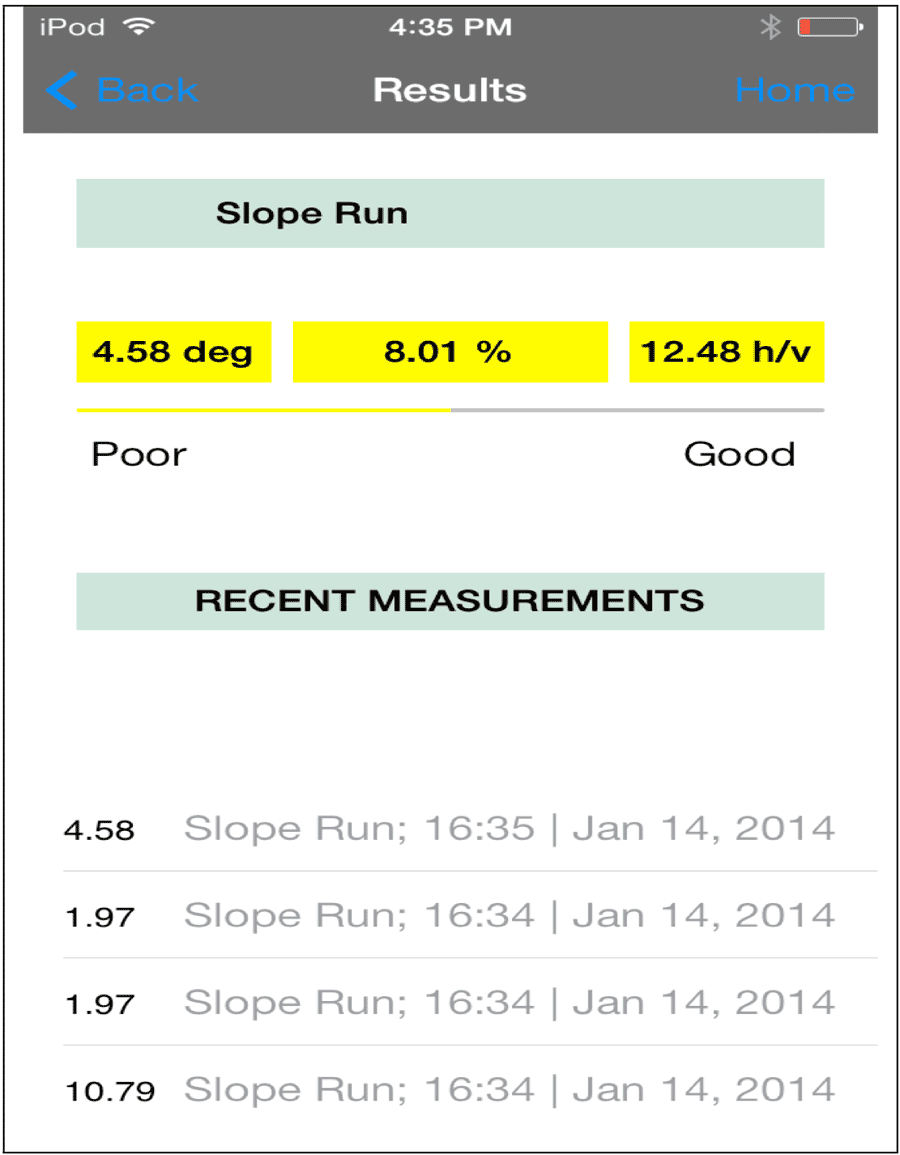 Figure 4. Screenshots of the Access Slope Mini-Tool Mobile app data results screen.
As expected, both of the levels showed perfect internal consistency, and near perfect consistency when compared to each other (ICC=.997), although they did not have perfect agreement (ICC=.984). Both the iPod® and the iPad® were statistically significantly different, but almost always within 1 degree of the 4 foot level measurement. Only one measurement out of 48 for the iPad® was more than 1 degree off. Interestingly, the iPad® and iPod® always reported a slightly smaller slope than the levels. These results indicate that the ASMT is a valid and reliable instrument for measuring the accessibility of ramps. Because it is implemented on mobile devices, it makes it an easy and convenient tool for practitioners, advocates, building owners and inspectors, and most importantly, people with disabilities.
Future development will include versions for Android devices, and better storage and reporting of results, and voice command capabilities to allow for less need for handling the devices manually.
Future research will include inter- and intra-rater reliability, testing of our protocol for using the ASMT, and usability testing with advocates and people with disabilities in the field.References
Brubaker, C. E., McLAURIN, C. A., & McCLAY, I. S. (1986). Effects of side slope on wheelchair performance. J Rehabil Res Dev, 23(2), 55-57.
Gaal, R. P., Rebholtz, N., Hotchkiss, R. D., & Pfaelzer, P. F. (1997). Wheelchair rider injuries: causes and consequences for wheelchair design and selection. Journal of Rehabilitation Research and Development, 34(1), 58-71.
iHandy Inc. (2013). iHandy Level Free Retrieved January 6, 2014, from https://itunes.apple.com/us/app/ihandy-level-free/id299852753?mt=8
Kaye, H. S., Kang, T., & LaPlante, M. (2002). Wheelchair Use in the United States. Disability Statistics Center Retrieved January 6, 2013, from http://dsc.ucsf.edu/publication.php
McClain, L. (2000). Shopping Center Wheelchair Accessibility: Ongoing Advocacy to Implemnt the Americans with Disabilitites Act of 1990. Public Health Nursing, 17(3), 178-186.
Osterberg, A. E. (2010). Access for Everyone (3rd ed.): Iowa State University
U.S. Architectural and Transporation Barriers Compliance Board. (1990). Americans With Disabilities Act Accessibility Guidelines for Buildings and Facilities Pub.L. 101-336, 104 Stat. 327, enacted July 26, 1990 (Vol. 42 U.S.C. § 12101).
Xiang, H., Chany, A., & Smith, G. A. (2006). Wheelchair related injuries treated in US emergency departments. Injury prevention, 12(1), 8-11.
ADA Best Practices Tool Kit for State and Local Governments Appendices 1 and 2. (2009) Retrieved from http://www.ada.gov/pcatoolkit/introapp1and2.htm
Acknowledgements
The AR-B Project is supported in part by the Department of Education, National Institute on Disability and Rehabilitation Research (NIDRR), grant number H133G100211. The opinions contained in this poster do not necessarily represent the policy of the U.S. Department of Education, and you should not assume endorsement by the Federal Government.
Audio Version PDF Version