Greg J. Williams1, Ting Zhang1, Alexander Lo1, Ashleigh Gonzales2, D. Page Baluch2, Bradley S. Duerstock1
1Purdue University, 2Arizona State University
INTRODUCTION
Visual images, whether graphs, charts, diagrams, photographs, models, or actual specimens, have always been an important part of the educational process as an efficient way of conveying information. This is particularly true for science disciplines. Indeed, in today’s world of rapidly proliferating information, in an effort to concisely present this information, the trend is toward more stand-alone graphics. According to Burch and Pawluk (2011), over 70% of textbooks contain diagrams with no accompanying description in the text. This means that paradoxically while the number of electronically available textbooks is greatly increasing, which should lead to increased access for people who are blind or visually impaired (BVI), the reliance on graphical representations causes the information to be more inaccessible.
Trying to find ways to represent visual scientific information tactilely is certainly not new. During medical school Dr. Jacob Bolotin, a blind physician in Chicago in the early twentieth century, relied on his mother, her friends, and his classmates to embroider the anatomy charts with yarn, thread, twine, wire, and straw. He also made models of dissected organs out of clay. (Perlmann 2007). Today many science education companies produce models for use in the classroom which, when combined with some description, are very useful for BVI students. Unfortunately textbook graphics are not produced by publishers in a tactile form and must still be specially produced for the BVI student as they were for Dr. Bolotin.
A century later many tactile graphics are still being produced by hand using similar techniques and materials as Mrs. Bolotin did or employing more sophisticated technologies for drawing raised lines and textures on paper (Edman 1992; BANA 2010). One such method is to produce a duplicate of graphics with a vacuum-form machine (thermoform machine) which applies heat and vacuum-pressure to a plastic sheet laid over the master (BANA 2010). Alternatively the master graphic can be created with a computer graphics program from scratch or by modifying the original graphic. It can then be embossed on a braille embosser with graphics capabilities or printed onto microcapsule paper (paper containing small capsules of alcohol). The microcapsule paper is then run through an image enhancer which heats it and causes any areas of gray or black to swell. The advantage of the computer methods is that they allow for sharing and easy modification of the original tactile graphic without degrading it while the older methods with thermoforming can produce graphics with greater variations in height and texture.
Because vision can interpret much more information than touch, tactile graphics cannot present all of the information of the visual image from which they are taken. This means that the person producing the tactile graphic must decide what information is necessary to convey and how best to accomplish that (BANA 2010). For this reason fully automating the conversion of images into tactile graphics is difficult, although one group was able to average conversion of images into tactile graphics to less than 10 minutes of human interaction per diagram for a selection of math and science books (Jayant, Renzelmann, Wen, Krisnandi, Ladner, & Comden, 2007).
Another approach to producing tactile graphics is the use of rapid prototyping methods such as computer numerically controlled machining (CNC) or 3D printing. Although these technologies have existed for a number of years, they have not been widely utilized because of cost. However, as the cost of 3D printers has fallen, there has been an increased interest in their use to produce tactile images. The goal is not to create full 3D models but to use height to enhance the 2D image. This so-called 2.5-dimensional image approach (similar to bas-relief) has been used to produce tactile paintings for museums (Reichinger, Maierhofer, & Purgathofer, 2011).
This research investigated whether the variation in height afforded by a 3D printer could be mapped to a characteristic of an image to produce tactile graphics where the salient features of the image are distinguishable to a BVI student? In particular we have mapped the height to the gray scale for several representative histological slides likely to be encountered in university biology courses.
METHODS
The following four steps were performed to generate a tactile plate from a 2D image using a 3D printer:
- Image Processing
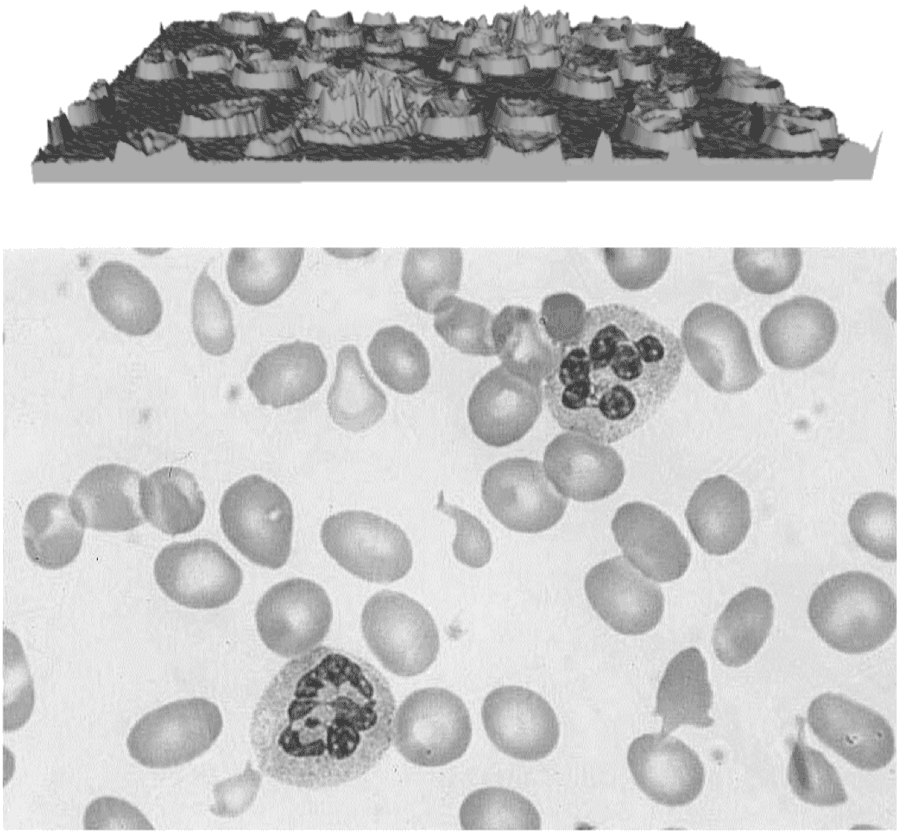
 Figure 1: Top: Generated 3D model. Bottom: Grayscale image.
 Before generating a 3D model, the first step was to convert the color image into grayscale using the rgb2gray function in Matlab. This function weighted the RGB values of each pixel to be assigned a number between 0 and 255, where 0 is black and 255 is white.
- Construct a 3D model
3D models were generated using the ModelBuilder1 library. The height of a pixel is inversely proportional to its intensity; therefore, black, with an intensity of 0, generated the highest pixel while white produced the lowest height. As demonstrated by the blood smear image in Figure 1, the nucleus of the white blood cell was the darkest feature and corresponded to the highest part of the 3D tactile plate.
- 3D model smoothing using MeshLab
MeshLab2 is an open source software for processing and editing unstructured 3D triangular meshes and provides taubin smoothing for smoothing the 3D model. Taubin smoothing is a low-pass filter algorithm based on Fourier analysis (Taubin, 1995). There were three parameters that could be modified, λ, µ and number of smoothing steps. λ is a number between 0 and 1, and µ is a negative number that is less than –λ. To determine the proper degree of smoothing for an image, we modified the smoothing steps keeping λ and µ fixed at λ= 0.7 and µ = -0.8.
- 3D-printing using MakerWare
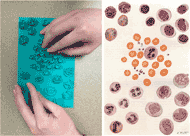 Figure 2: Reference Image and tactile plate of white blood cells
After processing, the size of the 3D models were modified using MakerBot’s MakerWare software and printed with the MakerBot Replicator 2X3 (see example in Fig. 2).
RESULTS
Five histology images were compared with examples of the 3D tactile plates. Table 1 shows the variable parameters that could be incorporated during the production of each tactile plate including: image scale, number of smoothing iterations to reduce the variations of pixel intensities, maximum height of black pixel values, number of features of interest, and other image filtering methods. The maximum height of the tactile plates was fixed at 0.5 inches which was suitable for all of the images used. These tactile plate parameters were examined by an individual who is blind and has extensive experience in using tactile graphics but a limited background in histology.
|
Histological Image |
Ratio of image scale bar to tactile plate |
Smoothing iterations |
Filtering Requirements |
Blood smear –RBCs large |
4:5 |
30, 50 |
None |
Blood smear –RBCs small |
4:3 |
15, 50 |
None |
Blood smear –RBCs enlargement |
1:2.1 |
30, 50 |
None |
Blood smear –RBCs swell paper |
2:3 |
NA |
None |
Blood smear -WBCS |
1:1.4 |
30 |
None |
Spinal cord cross-section |
1:1.1 |
30 |
None |
Spinal cord longitudinal |
1:1.15 |
30 |
None |
Spinal cord injured longitudinal |
1:1.4 |
30 |
None |
Stomach |
1:1.06 |
30 |
Blurred image |
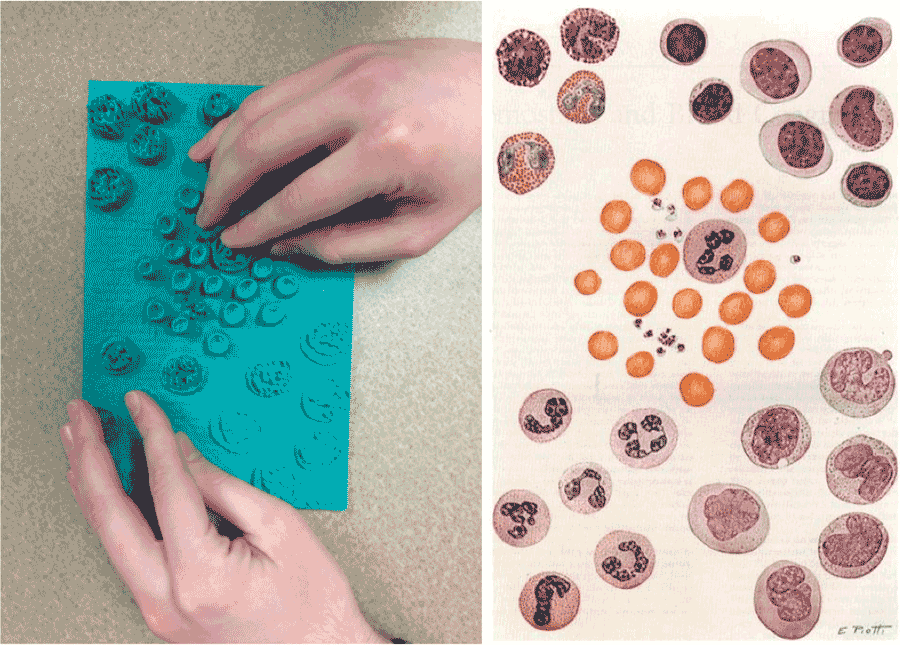
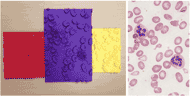 Figure 3: Blood smear tactile plates produced at three different scales from the image on the right. In the red tactile plate only one WBC is visible.
In Figure 3, a blood smear containing red and white blood cells with some abnormal red blood cells (RBCs) was explored as a tactile plate. In all iterations of the tactile graphic produced, the white blood cells (WBCs) were readily distinguishable from the RBCs. However, in the smaller scale tactile plates, the RBCs were too closely packed to easily distinguish the abnormally shaped ones (teardrop and sickle shaped cells). In the large scale plates, which were scaled up to the maximum size the printing platform would allow, the abnormal cells were easily identifiable.
The images with less smoothing technically provided more information by being less filtered through the averaging or blurring of neighboring pixels. It was determined that 15 versus 30 iterations did not convey any more useful information tactilely but further increased roughness of the plate, making it uncomfortable to the fingertips. However, on the scaled or enlarged image plates, it seemed that 50 iterations gave an overall better idea of the shape of the nucleus of WBCs.
A tactile image was also made using swell paper. As can be seen from Table 1, the swell paper image was larger than the large tactile plate. This image allowed for the identification of the white and red blood cells and the abnormal cells, but because of the limited variation in height possible using swell paper, not much detail of the shape of the nuclei of the WBCs could be determined. Also the 3D tactile plates provided more information about the relative concavity of the RBCs.
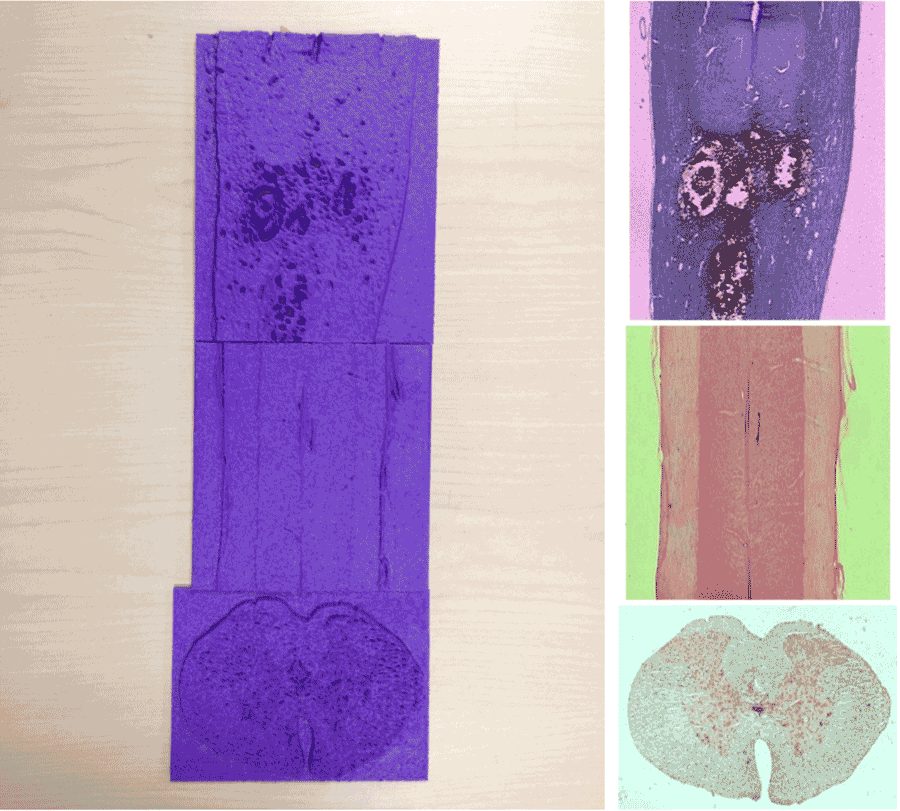 Figure 4: Spinal Cord tactile plates were generated from histological micrographs on the right. The bottom image shows a cross-section of the spinal cord.
The BVI researcher was given the tactile graphic in Figure 2 and informed that it contained RBCs and four types of WBCs and then asked to identify which of the four types of WBCs the ones in Figure 2 were. This proved impossible with the tactile graphics shown. It is possible that if each type of WBC were enlarged to the same scale as the partially enlarged blood smear, the type of the WBC could be distinguished; however, this is often a difficult task for sighted students.
Figure 4 shows three different slides of rat spinal cord and their corresponding tactile plates. The middle tactile plate was initially unclear to the BVI researcher; however, after being told that it was a longitudinal slice of spinal cord, identification of the boundaries between white and gray matter and the central canal was possible for the researcher. The other two spinal cord slides were similar in that the slides had to be explained before features became identifiable. For the injured spinal cord, the shape and location of the injury were tactilely discernible as well as the boundary between gray and white matter. For the cross section, again, many of the features were discernible; however, there were some physiological features that were not distinct enough to be identified. With a larger scale, they may have been.
 Figure 5: Cross-section of stomach
 In Figure 5, the colors denoting the different layers of stomach tissue in the micrograph are similar in color, and when they are converted into grayscale, they become nearly indistinguishable based on differences in intensity. Therefore, the image was first blurred, which increased the contrast of the colors, before being converted to gray scale. When asked to identify the number of layers in the image, only two were noted at first. After being told there were four layers in the image, part of a third layer was correctly identified. Only when directly shown where the fourth layer was, could it be found by using the fingernail to trace the narrow groove of the lighter colored layer between two darker layers. Unfortunately due to the size constraints of the printing platform, the entire image could not be printed at a much larger scale to provide higher definition.
DISCUSSION
Except for the blood smear, the blind researcher was unable to preemptively identify what the tactile graphics were without being told, but this is frequently the situation for students taking a histology class. Therefore, the most important feature of the tactile plate is that, once the content of the images were described, the features of the image could be tactilely identified.
Although this research looked at a relatively small set of histology images, if the images are able to be resolved into high contrast grayscale images, then 3D printing without much human intervention is a viable way of producing tactile graphics. There was no one set of parameters that was ideal for every image; however, a scale factor of between 1.2 and 2 and smoothing of between 30 and 50 iterations produced tactile graphics that typically allow the salient features to be distinguished. Therefore, a trained individual could reliably produce tactile plates without having a lot of histology knowledge.
One definite limitation of 3D plate printing compared to standard methods is the size constraint of the printing platform. Another disadvantage is the time required to printout an image, which can be anywhere from two to six hours with our current equipment. This makes it currently impractical for on-demand graphics though, as the technology develops, this will likely change. Certainly, the ability to use height to represent the grayscale intensity of an image (or potentially another characteristic) is a distinct advantage over standard methods. If this method is used to produce tactile graphics for an entire course, the 3D printing time would not be important. Also 3D printed images should be more durable than current methods and could be used repeatedly over the course of many years. Because the images come from computer files, they can be transferred to and printed by anyone with the proper equipment.
Although not all of the software used for this research was accessible, it should be feasible to develop a workflow that would allow a BVI person to take an image and process it and 3D print a tactile image without assistance. It may not always produce the ideal graphic, but assuming that the general content of the image was known, the details should usually be discernible.
REFERENCES
Braille Authority of North America, & Canadian Braille Authority. (2010). Guidelines and Standards for Tactile Graphics, 2010. Louisville, KY: American Printing House for the Blind.
Burch, D., & Pawluk, D. (2011). Using Multiple Contacts with Texture-Enhanced Graphics. In 2011 IEEE World Haptics, Istanbul,Turkey, 21-24 June 2011 (pp. 287-292).
Edman, P.K. (1992). Tactile Graphics. New York, NY: American Foundation for the Blind.
Jayant, C., Renzelmann, M., Wen, D., Krisnandi, S., Ladner, R., & Comden, D. (2007). Automated tactile graphics translation: In the field. In Proceedings of 9th International ACM SIGACCESS Conference on Computers and Accessibility (Assets’07) (pp. 75–82). New York, NY: ACM.
Perlman, R. (2007). The Blind Doctor: The Jacob Bolotin Story. Santa Barbara, CA: Blue Point Books.
Reichinger, A., Maierhofer, S., & Purgathofer, W. (2011). High-Quality Tactile Paintings. Journal of Computing and Cultural Heritage, 4(2), 5:1–5:13.
Taubin, G. (1995). A Signal Processing Approach to Fair Surface Design. In Proceedings of the 22Nd Annual Conference on Computer Graphics and Interactive Techniques (pp. 351–358). New York, NY: ACM.
FOOTNOTES
1ModelBuilder Library 2011 by Watz, M. http://workshop.evolutionzone.com/2011/04/06/code-modelbuilder-library-public-release/
2MeshLab (V. 1.3.2) by 3D-CoForm Consortium. http://meshlab.sourceforge.net/
3MakerBot Replicator 2X by MakerBot. Phone: 347-334-6800. http://www.makerbot.com/
ACKNOWLEDGEMENTS
This project was supported by the National Institute of Health Director's ARRA Pathfinder Award to Promote Diversity in the Scientific Workplace (1DP4GM096842-01 to B.S.D.). Financial assistance was also provided by the State of Indiana through the Center for Paralysis Research at Purdue University.
Audio Version PDF Version