The dispersion index as a metric for measuring pressure distribution on seat surfaces: a Pilot study
Carmen DiGiovine1,2,3, Marcia Nahikian-Nelms4, Susan White5, Matthew Yankie1
1Assistive Technology Center, The Ohio State University Wexner Medical Center
2Biomedical Engineering Department, The Ohio State University
3Occupational Therapy Division, The Ohio State University
4 Medical Dietetics Division, The Ohio State University
5 Health Information Management and Systems, The Ohio State University
ABSTRACT
Individuals with a spinal cord injury (SCI) are at a high risk for the development of a pressure ulcer at some point in their life. Therefore, there is a need to predict and prevent the development of pressure ulcers. Besides pressure, a significant risk factor is the nutritional status of the individual. The purpose of this study is to describe the effectiveness of seat surfaces based on the pressure distribution characteristics for individuals with a SCI. The dispersion index (DI) was measured for seven individuals with a spinal cord injury while on six different seating surfaces. The DI was less than 50 for all individuals when on their own cushion. The differences between the plinth and all other seating surfaces were significant. Furthermore, the differences between the foam/air cushions and the foam/honeycomb cushions were significant. Given the small sample size, the DI may be an appropriate metric for characterizing the pressure distribution, and may be useful when developing models describing the development of pressure ulcers.
Introduction
According to researchers, 24% of individuals with a spinal cord injury (SCI) experience a pressure ulcer during their rehabilitation hospital stay, 15% experience a pressure ulcer within the 1st year, and between 5% and 85% will develop a pressure ulcer in their lifetime (Chen, Devivo, & Jackson, 2005; McKinley, Jackson, Cardenas, & DeVivo, 1999; Richardson & Meyer, 1981; Salzberg et al., 1996; Young, Railton, Harrower, & Brookes, 1981). Furthermore, adults who lack adequate calories, protein, or other nutrients needed for tissue maintenance and repair will experience undernutrition. In acute, chronic, and transitional care settings, recognition and treatment of adult undernutrition is a primary concern (Jensen et al., 2010; Tappenden et al., 2013; White et al., 2012). The Academy of Nutrition and Dietetics provides nutrition recommendations for the individuals with a spinal cord injury within their evidence analysis guidelines (Thompson, Paison DiTucci, & Barton, 2013) Therefore, there is a clinical need to characterize the wheelchair seating system in terms of pressure at the seat cushion interface and nutritional status of individuals with a spinal cord injury.
The long-term goal of this study includes describing the nutritional status of individuals with a SCI, the pressure relieving characteristics of an individual’s seat cushion, and the risk of pressure ulcer development. The purpose of the pilot study described in this paper is to start addressing the second long term goal: characterize the pressure distribution properties of seat cushions using the dispersion index for individuals with a SCI.
Methods
Study Procedures
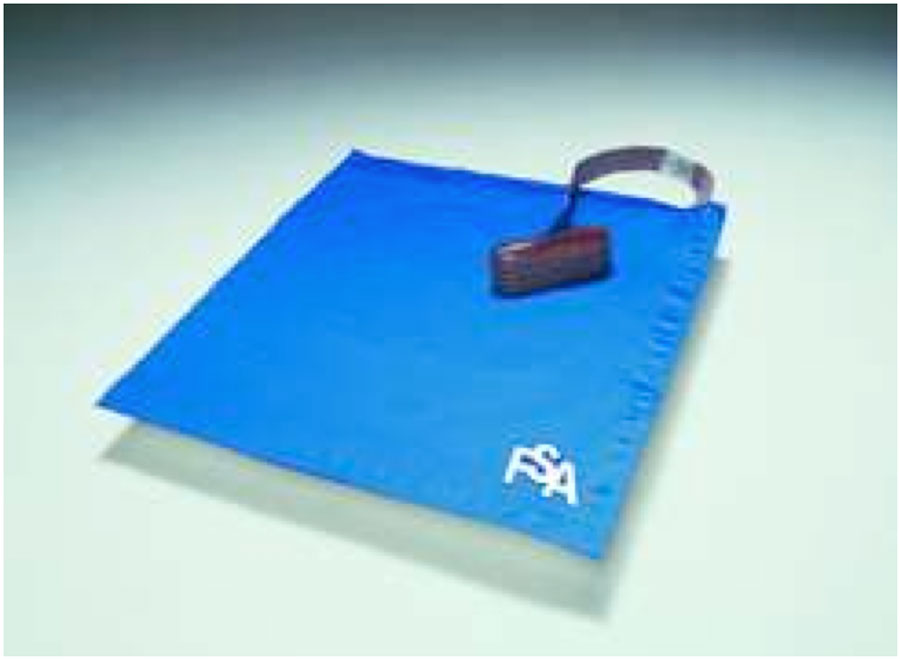
The measurement of pressure took place on the individuals own seat cushion and five other seating surfaces: a plinth, a foam cushion, an air cushion, a gel cushion and a honeycomb composite cushion. Pressure and temperature measurements were recorded at 30 seconds, 60 seconds and 120 seconds. Measurements were repeated 3 times for each seating surface totaling nine measures for each seating surface. The individual remained in their own wheelchair for all measurements, except those on the plinth.
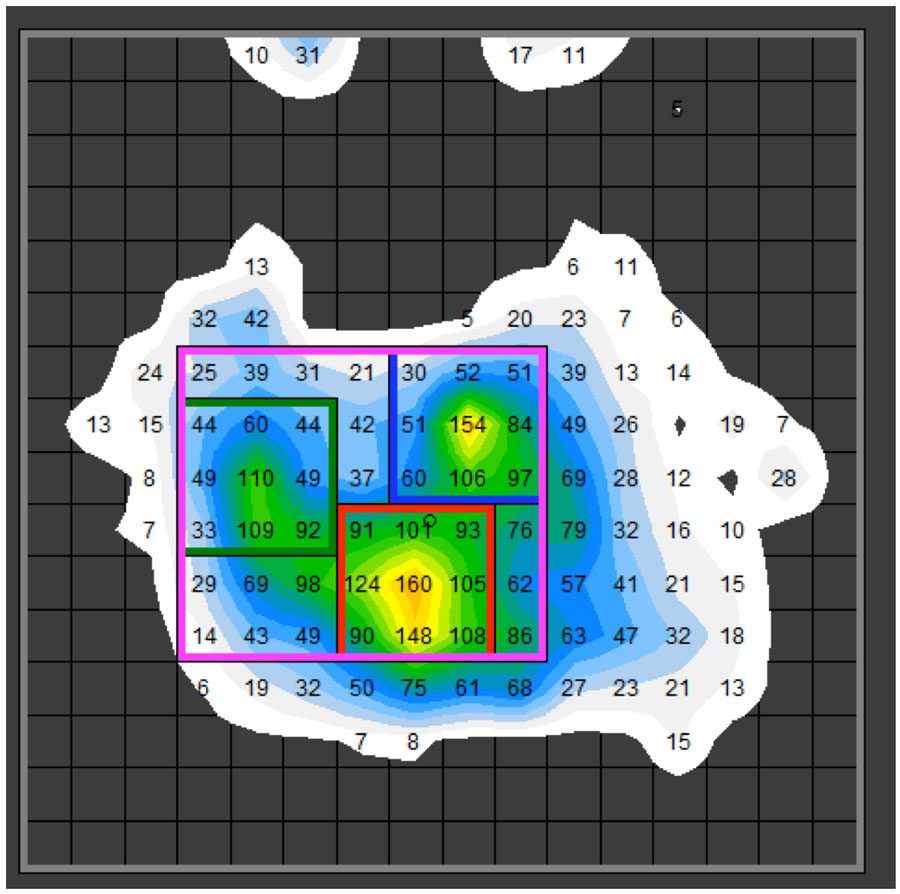
Data Analysis
Results
Seven individuals provided informed consent to participate in the study (6 men, 1 women) with a mean age of 35.6 years (12 st. dev., range 23-53 years). The individuals had a mean height and weight of 176.7 cm (4.4 st. dev., range 170.2 – 182.9 cm) and 84.2 kg (13.7 st. dev., range 65.8 – 104.0 kg). The mean time since injury was 10.9 years (st. dev. 12.0, range 0.5 -28.5 years). In terms of their primary mode of mobility, 6 used power wheelchairs and 1 used manual wheelchairs. Three individuals used a gel based seat cushion, and four individuals used an air based seat cushion. Six individuals had a cervical spinal cord injury, and one had a thoracic spinal cord injury.
Discussion
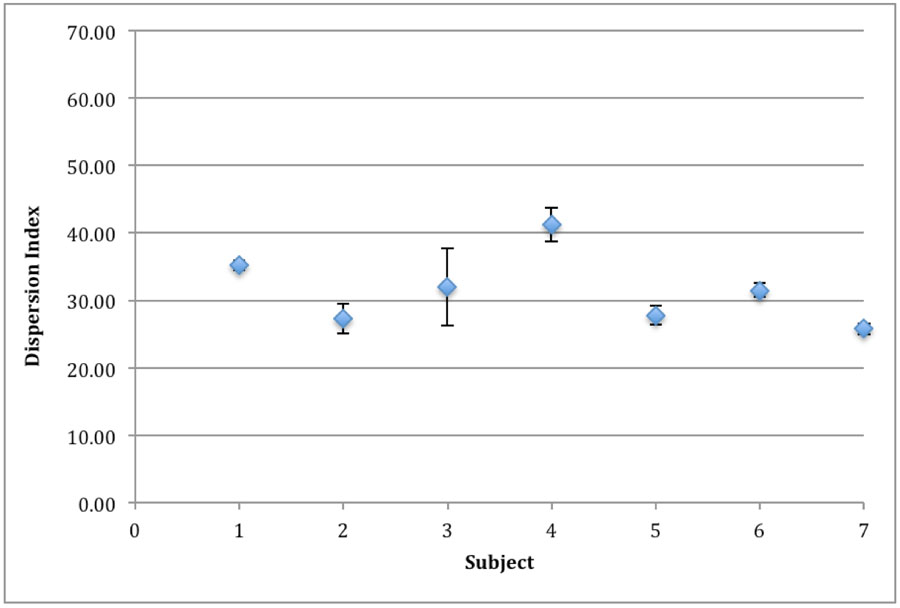
The dispersion index as a metric for differentiating between groups of individuals and the effectiveness of seat cushions seems reasonable based on the data collected for the pilot study. Differences in the mean DI were observed across the subjects (Figure 4). Specifically, the DI was above 50 for participant #3 and #4. Whether this has specific implications as it relates to the nutritional status of the individual, the past history of pressure ulcers, or the development of pressure ulcers is not known at this time based on this data. However, this pilot study is a first step in further addressing the specific correlation between pressure, nutrition and past history of pressure ulcers.
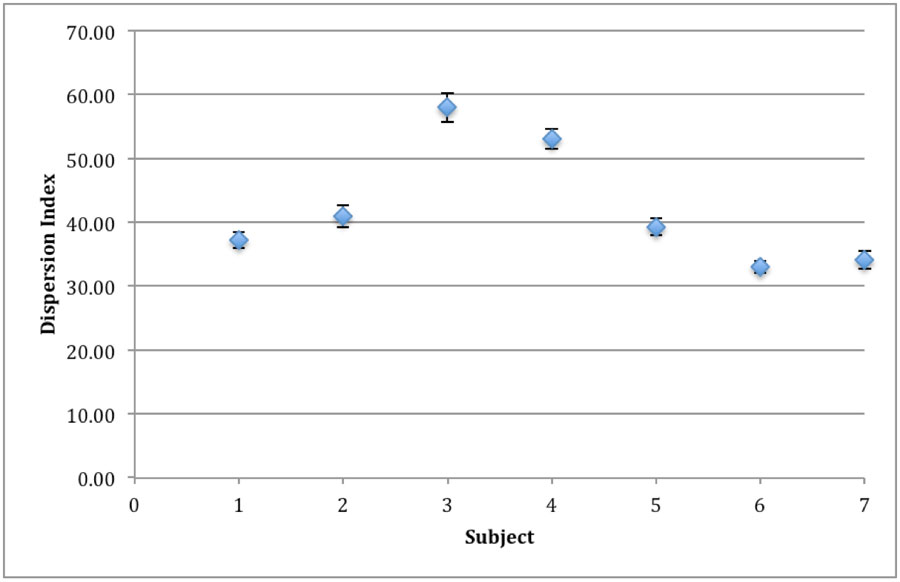
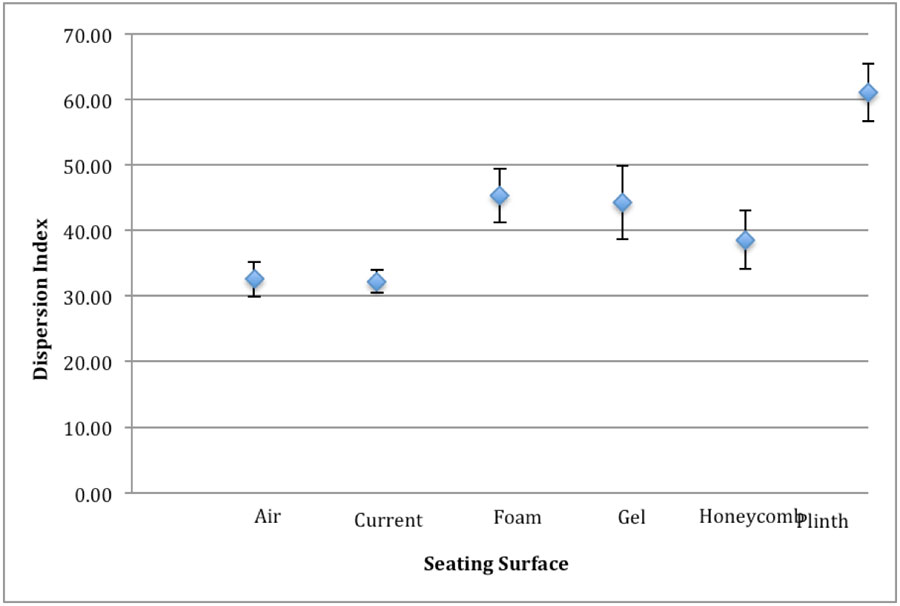
We were also able to differentiate between the seating surfaces based on the dispersion index. Based on our clinical knowledge we would expect the plinth to have the highest dispersion index, which we observed in figure 5. Furthermore, even with only seven individuals, we observe that the difference in the dispersion index between the plinth and the other seating surfaces is significant. The mean DI for the plinth is well above 50, while the mean of all of the other seating surfaces is below 50. This provides supporting evidence that 50 may be a good starting point for identifying effective seating surfaces. However, further stratification of the DI to describe the effectiveness is still necessary.
Differentiation among the seat cushions was observed between the foam/air combination and the foam/honeycomb combination. This demonstrates the potential to differentiate effectiveness of seat cushions for individuals with a spinal cord injury. The differentiation of the seat cushions based on the DI could allow for the stratification of seating surfaces which is necessary to begin developing pressure ulcer development models that also include the individual’s nutritional status.
The limitations to this study include the small number of participants, and the fact that we only looked at a single metric. Furthermore, this is a cross-sectional study, therefore we did not measure the pressure over a long period time to determine if the dispersion index would work outside the clinical setting. Each individual used his or her own wheelchair and seating system which may have affected the results, however, we used their own system in order to minimize postural changes. Finally, the individuals were positioned in their ideal seating position (e.g. hips back, pelvic belt properly positioned), which may not accurately represent how a person utilizes a wheelchair in the community.
Future studies include examining other pressure related variables, and examining correlations between past history of pressure ulcers and nutritional status. The combination of pressure and nutritional status may lead to a reduction in the development of pressure ulcers for individuals with a spinal cord injury, an improved healing when one occurs.
CONCLUSION
The effectiveness of seating surfaces to distribute pressure was examined for seven individuals with a spinal cord injury. The dispersion index, a measure to describe seating surface effectiveness, was below 50 for each individual on their own seat cushion, thereby indicating a minimum threshold is met in terms of pressure distribution. Differences in the pressure distribution were observed from subject to subject and cushion to cushion. This indicates that the dispersion index may be a useful dependent variable when identifying relationships with other pressure ulcer risk factors. Future, research will focus on developing models that include pressure, pressure ulcer history and nutritional status in the prediction and prevention of pressure ulcer development.
References
Chen, Y., Devivo, M. J., & Jackson, A. B. (2005). Pressure ulcer prevalence in people with spinal cord injury: age-period-duration effects. Archives of Physical Medicine and Rehabilitation, 86(6), 1208–1213. doi:10.1016/j.apmr.2004.12.023
Davis, K., & Sprigle, S. (2008). The Science of Interface Pressure Mapping - Updates for Clinical Application. In M. Story & D. Cooper (Eds.), (Vol. Vancouver, BC Canada, pp. 197–200). Presented at the 24th International Seating Symposium, Interprofessional Continuing Education - The University of British Columbia.
Jensen, G. L., Mirtallo, J., Compher, C., Dhaliwal, R., Forbes, A., Grijalba, R. F., … International Consensus Guideline Committee. (2010). Adult starvation and disease-related malnutrition: a proposal for etiology-based diagnosis in the clinical practice setting from the International Consensus Guideline Committee. JPEN. Journal of Parenteral and Enteral Nutrition, 34(2), 156–159. doi:10.1177/0148607110361910
McKinley, W. O., Jackson, A. B., Cardenas, D. D., & DeVivo, M. J. (1999). Long-term medical complications after traumatic spinal cord injury: a regional model systems analysis. Archives of Physical Medicine and Rehabilitation, 80(11), 1402–1410.
Richardson, R. R., & Meyer, P. R., Jr. (1981). Prevalence and incidence of pressure sores in acute spinal cord injuries. Paraplegia, 19(4), 235–247. doi:10.1038/sc.1981.47
Salzberg, C. A., Byrne, D. W., Cayten, C. G., van Niewerburgh, P., Murphy, J. G., & Viehbeck, M. (1996). A new pressure ulcer risk assessment scale for individuals with spinal cord injury. American Journal of Physical Medicine & Rehabilitation / Association of Academic Physiatrists, 75(2), 96–104.
Sprigle, S., Dunlop, W., & Press, L. (2003). Reliability of bench tests of interface pressure. Assist Technol, 15(1), 49–57.
Tappenden, K. A., Quatrara, B., Parkhurst, M. L., Malone, A. M., Fanjiang, G., & Ziegler, T. R. (2013). Critical role of nutrition in improving quality of care: an interdisciplinary call to action to address adult hospital malnutrition. Medsurg Nursing: Official Journal of the Academy of Medical-Surgical Nurses, 22(3), 147–165.
Thompson, K., Paison DiTucci, A., & Barton, V. (2013). Spinal Cord Injury and Nutrition Evidence Analysis Project. Academy of Nutrition and Dietitcs. Evidence Analysis Library. Retrieved from http://andevidencelibrary.com/topic.cfm?cat=1407
White, J. V., Guenter, P., Jensen, G., Malone, A., Schofield, M., Academy of Nutrition and Dietetics Malnutrition Work Group, … A.S.P.E.N. Board of Directors. (2012). Consensus statement of the Academy of Nutrition and Dietetics/American Society for Parenteral and Enteral Nutrition: characteristics recommended for the identification and documentation of adult malnutrition (undernutrition). Journal of the Academy of Nutrition and Dietetics, 112(5), 730–738. doi:10.1016/j.jand.2012.03.012
Young, K. C., Railton, R., Harrower, A. D., & Brookes, R. W. (1981). Transcutaneous oxygen tension measurements as a method of assessing peripheral vascular disease. Clinical Physics and Physiological Measurement: An Official Journal of the Hospital Physicists’ Association, Deutsche Gesellschaft Für Medizinische Physik and the European Federation of Organisations for Medical Physics, 2(2), 147–151.
Acknowledgements
We would like to acknowledge Hannah Oakley, Division of Medical Dietetics, School of Health and Rehabilitation Sciences, The Ohio State University for her assistance is collecting and synthesizing the data. We would also like to acknowledge the School of Health and Rehabilitation Sciences, The Ohio State University for funding this project.