What do we sit on? Anatomy of the seated buttocks
Sharon Eve Sonenblum1, Stephen H. Sprigle1, John M. Cathcart2, Robert J. Winder2
1Rehabilitation Engineering and Applied Research Laboratory, Georgia Institute of Technology; 2School of Health Sciences, University of UlsterIntroduction
Sitting for extended periods is common across many populations, with reports of healthy adults sitting for more than 6 hours per day 1,2. But for individuals who use wheelchairs as their primary mobility device, sitting times have been measured as upwards of 10 - 12 hours per day 3-5. These individuals typically have reduced mobility and sensation, and therefore they are at increased risk of tissue breakdown and pressure ulcer development.
Pressure ulcers, by definition, result from localized tissue loading that causes a series of pathophysiological responses to deformation. The precise mechanisms by which internal loading and physiological responses lead to pressure ulcers are not known, however deformation contributes to damage both directly and indirectly (i.e., by impairing blood flow) 6,7. Individuals with SCI can exhibit much greater deformation during sitting due to changes to buttocks tissue mass and compliance, leading to greater risk of pressure ulcer development.
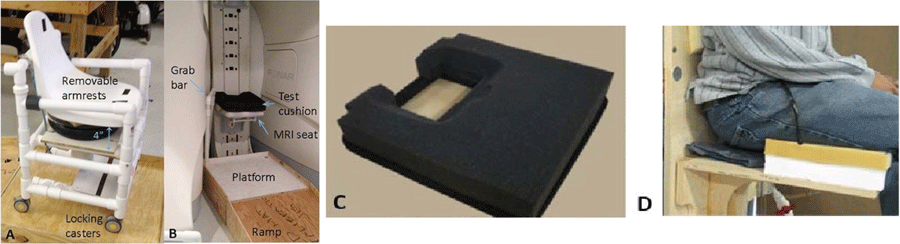 Figure 1. (A) MRI-compatible transfer chair used to transport participants into the scanner area (B). Two different cushions were used to unload the ischial tuberosities (C&D).
Therefore, the overall objective of this paper was to describe the 3D anatomy of the buttocks during sitting.
Methods
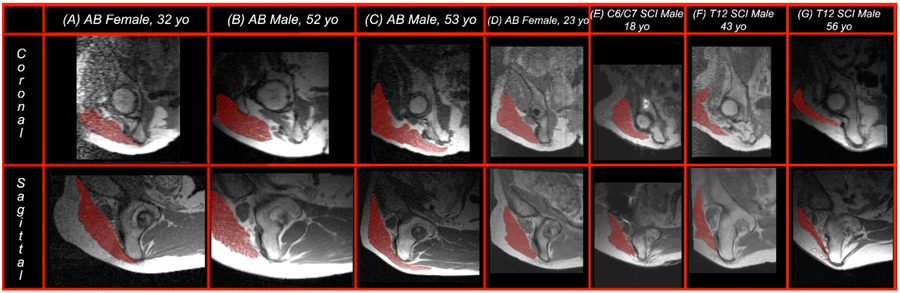 Figure 2. Coronal and sagittal views of the seated buttocks (on foam).
Multi-planar scans were analyzed using Analyze 11.0, and the muscles, bones and adipose tissues were manually segmented for 3D rendering and further analyses. Matlab 2013 was used to calculate the percent of gluteus coverage (%GlutCoverage), defined as the percent of a 50 mm cylindrical region of interest at the peak of the IT covered by at least 2mm of gluteus maximus.
RESULTS
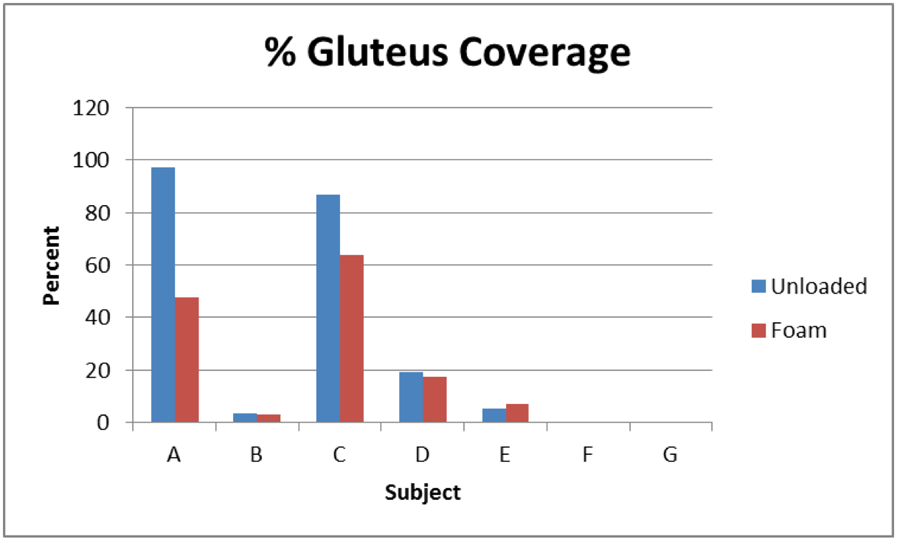 Figure 3. Percent of IT region of interest covered by gluteus maximus.
In Subject C, an able-bodied male, the gluteus maximus covers the body of the ischium including the tuberosity and is largely positioned posteriorly and lateral to that bony prominence. The gluteus maximus of Subject G, a male with SCI, rests entirely posterior and lateral to the ischium. It is not loaded by the ischium as he sits upon the foam cushion.
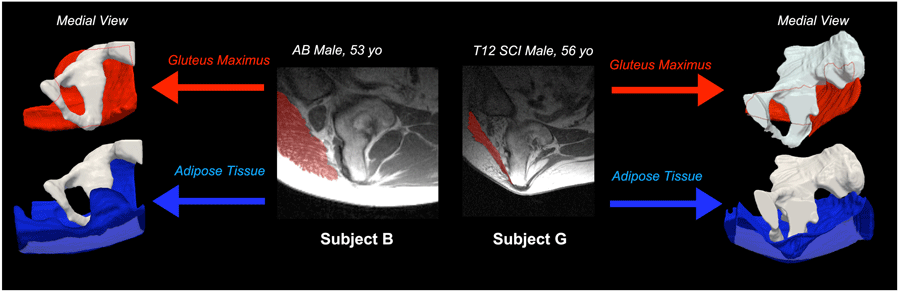 Figure 4. Sagittal MRI slices near the peak of the IT are presented with the gluteus maximus highlighted in red. 3D renderings of one side of the pelvis are also presented for both subjects, along with renderings of the gluteus maximus (red) and subcutaneous adipose (blue). The adipose tissue, presented as a hollow object cut open with the top layer representing the interface nearest the ischium.
Figure 4 compares the buttocks anatomy of Subjects B and G. Although Subject B is able-bodied and Subject G has an SCI, it is clear that neither IT is covered with muscle, although Subject G presents with significant atrophy of the gluteus maximus. The adipose tissue, presented as a hollow object cut open, shows how the tissue remains supported for Subject B, but wraps closely around the ischium of Subject G.
Discussion
This is the first study to investigate the 3-dimensional anatomical characteristics and tissue deformation of the seated buttocks across multiple people, including able-bodied and individuals with SCI.
One of the most significant observations from this study was that the tissue beneath the ITs of the participants was predominantly composed of fat and connective tissue, with little or no muscle present under the IT. This is inconsistent with the assumptions dominating the pressure ulcer and seating literature. Yet the results above suggest that the muscle, particularly the gluteus maximus, is often not loaded directly by the bone, and is therefore unlikely to experience the largest stresses and strains of the buttocks tissue at the ischial interface. Therefore, PU research should address the loading on fat and connective tissue as tissues that may herald necrosis during DTI formation.
This study also illustrated the importance of using multi-planar imaging rather than single planes to investigate anatomy of the buttocks. Multi-planar imaging provided the surprising results that 5 out of 7 participants did not sit on muscle, and that whether or not an individual sat on muscle was not a function of muscle atrophy.
References
- Raijmakers BG, Nieuwenhuizen MG, Beckerman H, de Groot S. Differences in the Course of Daily Activity Level Between Persons with and Without Chronic Pain. American journal of physical medicine & rehabilitation / Association of Academic Physiatrists. 2014.
- Jancey J, Tye M, McGann S, Blackford K, Lee AH. Application of the Occupational Sitting and Physical Activity Questionnaire (OSPAQ) to office based workers. BMC public health. 2014;14:762.
- Sonenblum SE, Sprigle S, Lopez RA. Manual wheelchair use: bouts of mobility in everyday life. Rehabil Res Pract. 2012;2012:753165.
- Sonenblum SE, Sprigle S, Harris FH, Maurer CL. Characterization of power wheelchair use in the home and community. Arch Phys Med Rehabil. 2008;89(3):486-491.
- Sonenblum SE, Sprigle S. Distinct tilting behaviours with power tilt-in-space systems. Disabil Rehabil Assist Technol. 2011;6(6):526-535.
- Bouten CV, Breuls RG, Peeters EA, Oomens CW, Baaijens FP. In vitro models to study compressive strain-induced muscle cell damage. Biorheology. 2003;40(1-3):383-388.
- Gawlitta D, Li W, Oomens CW, Baaijens FP, Bader DL, Bouten CV. The relative contributions of compression and hypoxia to development of muscle tissue damage: an in vitro study. Annals of biomedical engineering. 2007;35(2):273-284.
- Sonenblum SE, Sprigle SH, Cathcart JM, Winder RJ. 3-dimensional buttocks response to sitting: A case report. Journal of tissue viability. 2012.
- Sonenblum SE, Sprigle SH, Cathcart JM, Winder RJ. 3-dimensional buttocks response to sitting: a case report. J Tissue Viability. 2013;22(1):12-18.
Acknowledgements
This study was completed as part of the Mobility RERC, which is funded by the National Institute on Disability and Rehabilitation Research of the U.S. Department of Education under grant number H133E080003. The opinions contained in this paper are those of the grantee and do not necessarily reflect those of the U.S. Department of Education. Scan time was also supported by the College of Radiographers Industrial Partnership Scheme. Analysis software was generously provided by The Roho Group, Inc. We would also like to acknowledge Moises Araya for his assistance with segmentation and data processing.