Glenohumeral Joint Dynamics of children with Spinal cord injury during manual wheelchair mobility tasks
Chrissy Aurit1, Alyssa J. Schnorenberg1-3, Sergey Tarima3,6, Joseph Krzak4, Adam Graf4, Lawrence C. Vogel4, Gerald F. Harris3-5 and Brooke A. Slavens1-4
1Department of Occupational Science & Technology, University of Wisconsin-Milwaukee (UWM), Milwaukee, WI
2Rehabilitation Research Design and Disability (R2D2) Center, UWM, Milwaukee, WI
3Orthopaedic and Rehabilitation Engineering Center, MU and the Medical College of Wisconsin, Milwaukee, WI
4Shriners Hospitals for Children, Chicago, IL
5Department of Biomedical Engineering, Marquette University (MU), Milwaukee, WI
6Division of Biostatistics, Medical College of Wisconsin, Milwaukee, WI
Introduction
The overall incidence rate of pediatric spinal cord injury (SCI) in the United States between 1997 and 2000 was 1.99 cases per 100,000 children, resulting in an estimated 1455 children admitted to US hospitals each year for treatment of SCI (Vitale et al., 2012). Pediatric cases of SCI have been found to account for up to 10% of all SCIs (Chien, 2012).
In 2010 there were 124,000 wheelchair users under the age of 21, and 67,000 under the age of 15 (Brault, 2012). Children who have sustained a SCI may use a manual wheelchair (MWC) for functional, home and community mobility. Functional mobility may include moving over various terrains, starting from a stationary position and stopping their wheelchair within a reasonable distance (Case-Smith & O’Brien, 2010). Studies examining adult MWC users have found varying, and significantly different, upper extremity (UE) joint demands across mobility tasks including: level propulsion, ramp ascent, weight relief, start and stop (Morrow et al., 2010).
MWC use repetitively places increased load demands on the UEs. Common in MWC users is pain and secondary pathologies, particularly at the shoulder complex, including: shoulder impingement and rotator cuff tears. These secondary injuries impede an individual’s ability to propel and manipulate a MWC, thus decreasing their activity level and quality of life.
While there are many studies that consider the biomechanics of MWC use, few are focused on pediatric participants (Koontz et al., 2005) (Petuskey et al., 2007) (Rice et al., 2010) (Schnorenberg et al., 2014). Children are not physically proportionate to young adults or adults and we cannot assume that scaling the data will give an accurate picture of the true demands of propulsion. A study by Jensen confirmed changes in force and moment curves due to changes in proportionality and mass distribution that occur with age (Jensen, 1989). It is therefore important that current research focuses on the pediatric population to provide further insight into the unique biomechanics of young MWC users. This population is at an age when potentially risky movement habits are formed and development of secondary problems begins. This research may be helpful in improving clinical guidelines in order to slow or prevent the development of secondary pain and pathologies.
In order to identify potential risk factors, a clear understanding of the UE motions and loading is required during each mobility task. The primary purpose of this study is to quantify upper extremity kinematics and kinetics of pediatric MWC mobility during four functional tasks: 1) propulsion, 2) starting from a static position, 3) stopping from a steady state propulsion and 4) weight relief. We hypothesize that three-dimensional (3D) ranges of motion, forces and moments of the glenohumeral (GH) joint will be larger during each functional task than during propulsion.
Methods
Biomechanical Model
| Joint Motion | Mean ROM (deg) | |||
|---|---|---|---|---|
| Propulsion | Start | Stop | Weight Relief | |
| Adduction/Abduction | 23.66 (11.43) | 21.21 (8.23) | 7.96 (6.05)** | 14.67 (5.23) ** |
| Internal/External Rotation | 37.17(19.96) | 33.48 (15.29) | 14.75 (11.23)** | 73.56 (37.16)** |
| Flexion/Extension | 48.43 (13.51) | 44.49 (13.46) | 15.97 (13.02)** | 32.80 (8.00)** |
| * = p< .05 ** = p< .01 | ||||
| Force Direction | Mean Peak Force (% BW) | |||
|---|---|---|---|---|
| Propulsion | Start | Stop | Weight Relief | |
| Anterior (+) | 1.99 (3.29) | 3.07 (4.29) | 0.14 (3.53) | 12.01 (12.94)** |
| Posterior (-) | -6.65 (2.14) | -8.21 (3.54) | -4.48 (2.65) | -7.65 (12.31) |
| Superior(+) | 6.85 (1.53) | 6.74 (1.50) | 9.68 (4.89)** | 7.4 (1.30) |
| Inferior (-) | -2.43 (3.78) | -4.59 (5.31) | 3.70 (2.10)** | -21.19 (14.35)** |
| Lateral (+) | 4.79 (2.74) | 6.59 (4.62)** | 2.45 (2.18)** | 10.16 (5.16)** |
| Medial (-) | -2.72 (1.80) | -2.21 (2.02) | -1.12 (1.73)** | -1.19 (1.31)** |
| * = p< .05 ** = p< .01 | ||||
| Moment Direction | Moment Mean Peak Moment (% BWxH) | |||
|---|---|---|---|---|
| Propulsion | Start | Stop | Weight Relief | |
| Adduction (+) | 0.81 (0.51) | 1.07 (0.70) | 0.33 (0.72)* | 2.17 (1.73)** |
| Abduction (-) | -0.99 (0.89) | -1.31 (1.02) | -0.52 (0.36)* | -1.78 (1.98)** |
| Internal(+) | 0.86 (0.83) | 1.16 (0.98) | 0.36 (0.56) | 2.15 (1.77) |
| External(-) | -1.08 (3.83) | -0.77 (1.09) | -0.33 (0.30) | -0.87 (1.09) |
| Flexion (+) | 0.87 (0.92) | 0.99 (1.25) | 0.69 (0.62) | 2.57 (3.07)** |
| Extension (-) | -1.2 (0.76) | -1.13 (0.52) | -0.43 (0.60)** | -1.87 (1.79)** |
| * =p< .05 ** =p< .01 | ||||
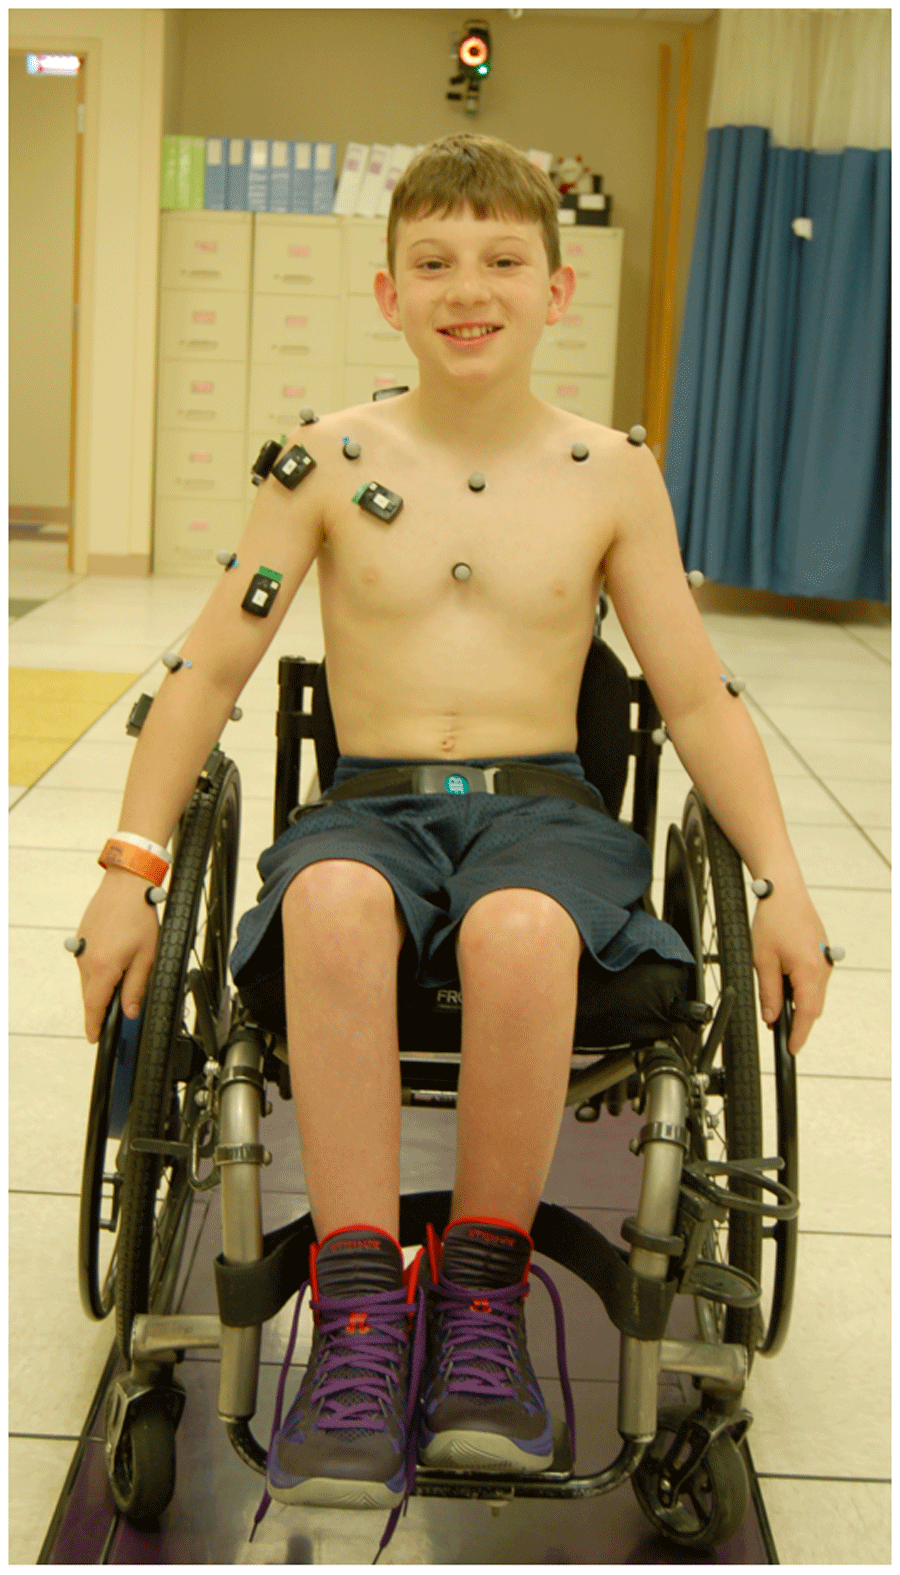
A custom pediatric UE biomechanical model was used for quantitative data collection and analysis (Schnorenberg et al., 2014). The model consists of 11 segments, including bilateral: clavicles, scapulae, upper arms, forearms and hands, and the thorax. This allows for analysis of the wrist, GH and acromioclavicular joints (three degrees-of-freedom) as well as the elbow and sternoclavicular joints (two degrees-of-freedom). Twenty-seven passive reflective markers are used to define and track each segment (Figure 1). The joint axes are embedded at the joint centers, which are calculated based on subject specific anthropometric measurements. Euler angle sequences determine the joint angles of the distal segment with respect to the proximal segment (for the GH joint, the scapula is proximal to the humerus).
A SmartWheel (OutFront, Mesa, AZ) was used to sense the three forces and three moments as applied by the hand to the wheelchair handrim during wheelchair mobility. The inverse dynamics method was then used in order to determine the forces and moments at each UE joint of interest through Newton-Euler equations of motion.
Protocol
Data collection occurred at the Motion Analysis Laboratory at Shriners Hospitals for Children - Chicago. Fourteen pediatric manual wheelchair users, 9 male and 5 female, with an average age of 13.7 +/- 4.8 years, participated in the study. The average height and weight of the subjects was 150 +/- 27 cm and 47 +/- 22 kg, respectively. All subjects were diagnosed with a SCI at least one year prior to participation. Subjects with other neurological conditions, or who underwent orthopaedic surgery within the past year, were excluded, as these may further limit their mobility or ability to participate. Subjects with UE joint contractures or who received botulinum toxin type-A in the past 6 to 12 months were also excluded.
The subjects propelled their MWCs along a 15 m walkway at a self-selected speed using a self-selected propulsion pattern. A 14-camera Vicon MX motion capture system collected the bilateral kinematic data at 120 Hz, while simultaneously a SmartWheel system collected the kinetic data at the hand-handrim interface at 240 Hz. The SmartWheel replaced the wheel on the subject’s dominant side. Eleven subjects were right hand dominant and three were left hand dominant. Subjects were allowed to rest between trials as needed.
Propulsion Task - Subjects were asked to propel their MWC across the room while staying on a colored walkway in the center of the capture volume (Figure 1). Ten stroke cycles were analyzed, excluding the first and last two strokes to eliminate effects of acceleration and deceleration.
Start Task - Subjects began at a static position in the center of the capture volume and then asked to propel themselves to the far side of the room (the end of the capture volume). The first stroke was analyzed for each of three trials.
Stop Task – The subject began outside of the capture volume in a static position. They were then asked to propel themselves into the room and to stop when they reached the center. The last stroke was analyzed for each of three trials.
Weight Relief Task - While seated in their wheelchair with their hands on the hand rim, subjects completed a weight relief push-up for approximately two seconds. Subjects who demonstrated difficulty with fully extending their elbows to complete this maneuver or were unable to hold the pose for two seconds, were instructed to complete the task to the best of their ability. Two trials were collected and analyzed.
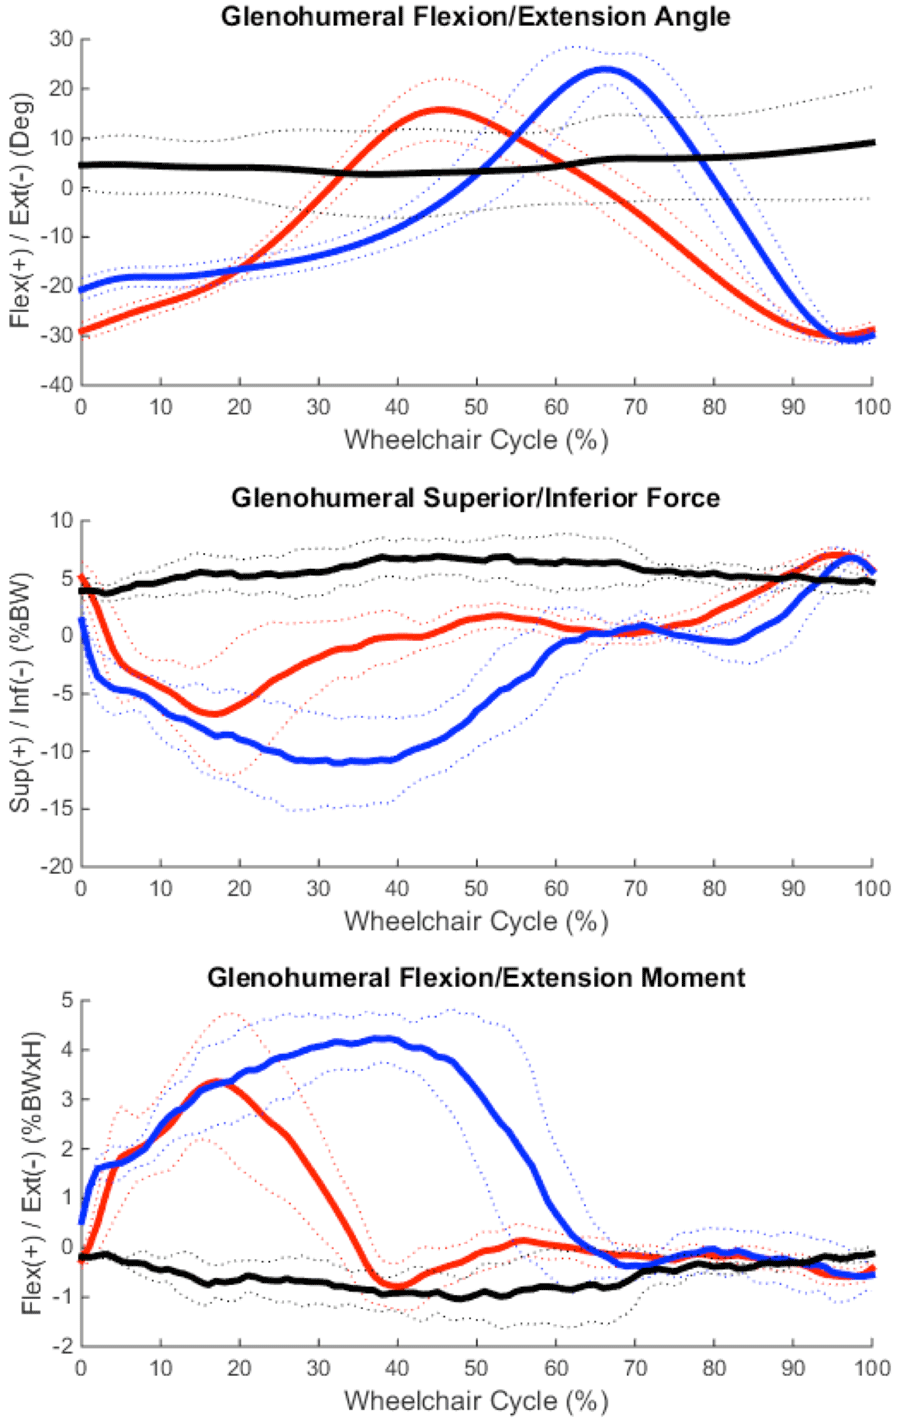
The GH joint kinematics and moments were determined in all three planes of motion: sagittal, coronal and transverse. Additionally, GH joint forces were determined along all three axes: medial/lateral, superior/inferior and anterior/posterior. Data was normalized to 100% percent stroke cycle and processed every 1%. The beginning of each stroke cycle, during the propulsion, start and stop tasks, was defined to occur when a resultant force was present on the handrim (Kwarciak et al. 2009). Forces were normalized to the subject’s body weight (%BW) and moments were normalized to the subject’s body weight and height (%BWxH). A one-way Analysis of Variance (ANOVA) with linear mixed model (LMM) analysis was performed to compare biomechanical outcomes of the GH joint during the start, stop and weight relief tasks to propulsion.
Results
Mean, +/- one standard deviation (stdev), joint angle, force and moment curves in each plane of motion were characterized over the wheelchair stroke cycle for the GH joint for the propulsion, start and stop tasks; data of one representative subject is depicted here (Figure 2).
Discussion
Only the mean peak lateral GH joint force was significantly greater during the start task versus steady-state propulsion. When comparing adult GH joint demands during similar manual wheelchair tasks, Morrow et al. found two significant differences: higher mean peak internal joint moments of extension and external rotation during the start task than propulsion task. These differences may be a result of population age, as the younger subjects in this study have not yet reached musculoskeletal maturity. This, in conjunction with muscle weakness common to SCI, may reduce the amount of force/moment they are capable of exerting. Additionally, the surprisingly small number of significant differences in mean peak values may indicate the need to examine other factors/parameters. For example, for the subject depicted in Figure 2, even though the peak values of force and moment for the start and propulsion tasks appear relatively similar, the duration over which the elevated forces and moments are exerted is much greater for the start task, which may be as a result of reduced physical capabilities. Therefore, the start task may more concerning for pain and pathology development than the propulsion task for a child whose activities increase the number of times the wheelchair must be started from a static position. Further research of the duration of the joint demands should be conducted.
One surprising result was the appearance that the stop task is the least demanding of the 4 tasks observed here. While Morrow et al. found the stop task to have relatively few significant differences compared to steady-state propulsion, this study found the stop task to have 9 significantly lower mean peak values. Only the superiorly directed force was greater during the stop task. This indicates that subjects placed their hands anteriorly and low on the wheelchair handrim when applying braking grasps, resulting in a pulling of the arm and the required superior force of the GH joint. The differences may be attributed to stopping techniques employed, which require further investigation. Especially if the high superior force observed here may be distributed more evenly in other directions.
All but one parameter (external moment) was greater during the weight relief task than during steady state propulsion, with 8 of the 12 parameters showing statistically significant increases. Morrow et al. also found the weight relief task to be the most demanding on the GH joint in adult MWC users (Morrow et al. 2010). Given the frequency with which manual wheelchair users must perform weight relief tasks, current clinical recommendations are to complete weight relief maneuvers every fifteen minutes (AHCPR, 1992), the task as recommended may require joint demands that could prove injurious in the long term.
Other factors that may account for the differences between this young population study and the adults in Morrow et al., and data variability are: stroke patterns, propulsion speeds, age, SCI level and time of device use. Further investigation, and subject-specific analyses, is warranted to determine which joint demands of various MWC mobility tasks may be most likely to contribute to pain and pathology that are commonly developed in MWC users.
Conclusion
This study successfully quantified 3D GH joint dynamics during pediatric manual wheelchair mobility tasks. In comparison to the steady-state propulsion task, the resulting mean peak dynamics suggest that the weight relief is more demanding on the GH joint, the stop task is less demanding and the start task is of equal demands. These results are not fully consistent with adult data, possibly influenced by the musculoskeletal differences of the younger population. Further investigation into other possible influential factors such as duration of load demands, subject age, SCI level, and time of MWC use is warranted. A greater understanding of shoulder biomechanics should assist in identification of risk factors leading to pain and pathology development in pediatric MWC users and thus improve clinical guidelines, training and rehabilitation.
References
Agency for Health Care Policy and Research (AHCPR). (1992). Pressure ulcers in adults: prediction and prevention. Clin Prat Guidel Quick Ref Guide Clin, 3, 1-15.
Brault, M.W. (2012). Americans with disabilities: 2010. Current Population Reports, Washington, DC: US Census Bureau, 70-131.
Case-Smith, J., & O’Brien, J. C. (2010). Occupational therapy for children. Maryland Heights, Mo.: Mosby/Elsevier.
Chien, L., Wu, J., Chen, Y., Liu, L., Huang, W., Chen, T., Thien, P., Lo, S. Cheng, H. (2012). Age, sex, and socio-economic status affet the incidence of pediatric spinal cord injury: an eleven-year national cohort study. PLoS ONE, 7(6).
Jensen, R.K. (1989). Changes in segment inertia proportions between 4 and 20 years. J Biomech, 22, 529–536.
Koontz, A. M., Cooper, R. A., Boninger, M. L., Yang, Y., Impink, B. G., & van der Woude, L. H. V. (2005). A kinetic analysis of manual wheelchair propulsion during start-up on select indoor and outdoor surfaces. J Rehabil Res Dev, 42(4), 447–458.
Morrow, M.B., Hurd, W.J., Kaufman, K.R., An, K. (2010). Shoulder demands in manual wheelchair users across a spectrum of activities. J Electromyogr Kinesiol, 20, 61-67.
Petuskey, K., Bagley, A., Abdala, E., James, M. A., & Rab, G. (2007). Upper extremity kinematics during functional activities: Three-dimensional studies in a normal pediatric population. Gait Posture, 25(4), 573–579.
Rice, I., Gagnon, D., Gallagher, J., & Boninger, M. (2010). Hand rim wheelchair propulsion training using biomechanical real-time visual feedback based on motor learning theory principles. J Spinal Cord Med, 33(1), 33–42.
Schnorenberg, A.J., Slavens, B.A., Wang, M., Vogel, L., Smith, P.A., Harris, G.F. (2014) Biomechanical model for evaluation of pediatric upper extremity joint dynamics during wheelchair mobility. J Biomech. 47, 269-276.
Vitale, M., Goss, J., Matsumoto, H., Roye, D. (2012). Epidemiology of pediatric spinal cord injury in the United States: years 1997 and 2000. J Pediatr Orthop, 26(6), 745-749.
Acknowledgements
We acknowledge the support of OREC and Shriners Hospitals for Children, Chicago. The contents of this work were developed under Department of Education (ED), NIDRR grant number H133E100007. However, the contents of this work do not necessarily represent the policy of the ED, and you should not assume endorsement by the Federal Government. Research reported here was also supported by the Eunice Kennedy Shriver National Institute of Child Health & Human Development of the National Institutes of Health under award number K12HD073945.