1-2KaLai Tsang, BS, 1-3Shivayogi Hiremath, PhD, 1-2Dan Ding, PhD
1Human Engineering Research Laboratories, Department of Veterans Affairs, Pittsburgh, PA 15206
2Department of Rehabilitation Science and Technology, University of Pittsburgh, Pittsburgh, PA 15260
3Department of Physical Medicine and Rehabilitation, University of Pittsburgh, Pittsburgh, PA 15213
ABSTRACT
Due to the lack of accurate and reliable commercial activity monitors for manual wheelchair users (MWUs), many researchers have been developing custom energy expenditure (EE) models that can be applied to this population. Nightingale et al. (2014) have recently developed two models that are tailored to MWUs based on a commercial monitor, ActiGraph GT3X (1) worn at the wrist and upper arm, respectively. In this study, we evaluated these models in eight MWUs during resting, wheelchair propulsion and arm ergometry exercises. The accuracy of the models was compared against the gold standard measured by a portable metabolic cart. Results showed that both wrist (Mean signed error (MSE): 5.16±94.8, Mean absolute error (MAE): 70.6±63.4%) and upper arm (MSE: 18.3±72.7%, MAE: 58.8±46.4%) models performed better than the manufacturer’s default model when applied to the wrist (MSE: -15.1±104.3%, MAE: 74.1±74.9%) and the upper arm (MSE: -34.5±133.9%, MAE: 103.8±91.2%). However, the custom models still yielded significant errors in estimating EE in MWUs. The estimated EE by the wrist and the upper arm models showed high correlations with the criterion EE (r=0.77 and 0.81 respectively), as well as high agreement (ICC (3, 1) = 0.79 and 0.86 respectively). A more accurate custom EE prediction model for a more diverse set of physical activities (PA) is needed to allow MWUs and clinicians to use ActiGraph for assessing the PA levels on a daily basis.
BACKGROUND
Regular physical activity (PA) provides numerous health benefits to manual wheelchair users (MWUs). Besides reducing risks of developing chronic diseases and health conditions such as cardiovascular diseases, diabetes, obesity, and cancers, regular PA also helps MWUs to develop and maintain joint flexibility, muscle strength, and balance (2, 3). In addition, Healthy People 2020 has reported that regular PA could provide MWUs a sense of control, enhance their feelings of well-being through emphasizing their abilities instead of their physical limitations, which in turn encourages MWUs to participate in their community and social events (2). Despite all the physical, physiological and psychological benefits, most MWUs still live a sedentary lifestyle. In most cases, they are not aware of what their current activity levels are, how much more PA they should be engaging in, and how often they should maintain the recommended PA level.
There are many commercially available activity monitors that aim to objectively measure the quantity of the PA of individuals on a daily basis. Some of these devices are proven to be accurate in predicting EE in ambulatory population, with relative error from -3.64% to -12.07% (4). However, none of them are designed for, and performed well in, MWUs who rely on their upper extremities for most of the PA. Without an accurate and reliable assessment tool, it is more challenging for MWUs to develop and maintain a healthy and active lifestyle. It is also difficult for clinicians to make any recommendations to MWUs on interventions that promote physical fitness. Hence, Nightingale et al. (2014) developed two custom energy expenditure (EE) prediction models for MWUs based on a commercial monitor, ActiGraph GT3X (1), when worn on the right wrist and upper arm, respectively. In this study, we evaluated the accuracy of the two models using a separate cohort of 8 MWUs. We hypothesized that the two prediction models would have a better overall performance in estimating EE in MWUs than the default model used in ActiGraph.
METHOD
The study was approved by the Institutional Review Board at the University of Pittsburgh. Eight subjects were recruited. Subjects were between 18 and 75 year-old, lived in the community, used manual wheelchairs as a primary means of mobility, were at least six months post-injury, medically stable, able to tolerate sitting for 3 hours, and had no active pelvic or thigh wounds. Subjects who were pregnant and had cardiovascular diseases at the time of testing were excluded.
Instrumentation
Two ActiGraph GT3X (ActiGraph, LLC.) and a K4b2 portable metabolic cart (COSMED srl, Rome, Italy) were worn by each subject during testing. Each subject wore an ActiGraph monitor on the dominant upper arm over the triceps and another one on the dominant wrist. Each subject also carried the K4b2 metabolic cart device over the chest area and wore a facial mask that collected gas sample during activity. Both ActiGraph devices were set at a sampling rate of 30Hz and the data were downloaded at 15s epoch using the ActiLife 6.1 software. The EE measured by the K4b2 was served as a criterion. The EE was estimated based on the custom EE prediction models recently developed by Nightingale et al. (2014) for the MWUs.
Custom prediction models (1)
The following two prediction models estimated the EE (kJ/min) using the activity counts per minute (CPM) measured by the ActiGraph monitors at the wrist and upper arm in all three (x, y, z) directions (Eq. 1 & 2).
| Eq. 1 | |
|---|---|
| Eq. 2 |
Procedure
The study was explained to the subjects, and written consent forms were obtained from them prior to participating in the study. Subjects were first asked to complete a basic demographic questionnaire and had their weight, height, and skinfold thickness at biceps, triceps, subscapular and suprailiac measured. After that, all subjects began with a 30 minute resting trial in which they sat in their own chair. Subjects were asked to perform any six activities from the following list: propulsion at self-selected normal, fast and slow speed, propulsion at a self-selected normal speed up and down a ramp, propulsion on a sidewalk, stop-and-go propulsion (propelled for a certain distance and stopped for 15-30s and then continued propulsion), performed arm ergometry exercises at self-selected normal, fast and slow speed and resistance. Subjects performed each activity of their choice for at least 10 minutes. In between trials, subjects were allowed to rest for at least 5 minutes. All the activities took place at a University based laboratory.
Data Analysis
The data from the K4b2 and the ActiGraph was analyzed using MATLAB (R2014a, The Mathworks Inc.) and SPSS Statistics 22 (IBM, Corporation). The unit of the predicted EE from the custom models was converted to kcal/min before any analysis. Both the predicted EE and the EE estimated by the default model of the ActiGraph monitor were compared against the criterion EE. The mean signed percent error (MSE) and mean absolute error (MAE) were calculated for both anatomical positions using Eq. 3 & 4. The Pearson coefficient of the predicted EE and the criterion EE were also computed to explore the strength of the relationship between the predicted EE and the criterion. The intraclass correlation coefficient (ICC) with absolute agreement was computed to evaluate the agreement of the prediction models and the ActiGraph default models in estimating EE. In addition, Bland-Altman plots were constructed to show the agreement of the predicted EE and the criterion. Results were presented in mean ± standard deviation.
| Eq. 3 | |
|---|---|
| Eq. 4 |
RESULTS
Eight MWUs were recruited, and seven of them were dominant on the right side. Six of them had spinal cord injury, one had spina bifida, and one was an amputee. Each of them successfully completed all six activity trials, including 33 to 55 minutes of wheelchair propulsion activities, 10 to 33 minutes of arm ergometry exercises, and 30 minutes of resting. The MSE and MAE of all activities (96 – 100 min) were computed for each subject (Table 1). Overall, the MSE showed that the default models, regardless of the anatomical positions, overestimated the EE; while the prediction models underestimated the EE. The wrist prediction model (MSE: 5.16±94.8, MAE: 70.6±63.4%) was slightly more accurate than the default model (MSE:
-15.1±104.3%, MAE: 74.1±74.9%). The upper arm prediction model (MSE: 18.3±72.7%, MAE: 58.8±46.4%) was also more accurate than the default model (MSE: -34.5±133.9%, MAE: 103.8±91.2%). All models, despite prediction and default, showed very large variations in EE estimation in MWUs.
Activity |
Wrist |
Arm |
|||
|---|---|---|---|---|---|
Default |
Prediction |
Default |
Prediction |
||
| MSE (%) | WP |
-58.3±78.0 |
-15.3±76.2 |
-87.1±107.0 |
-17.1±67.0 |
AE |
-57.3±117.0 |
-76.7±93.9 |
-123.1±138.6 |
-15.6±54.9 |
|
REST |
74.3±62.1 |
90.2±33.9 |
95.8±15.8 |
91.0±11.7 |
|
ALL |
-15.1±104.3 |
5.16±94.8 |
-34.5±133.9 |
18.3±72.7 |
|
| MSA (%) | WP |
65.1±72.4 |
47.1±61.7 |
94.4±97.9 |
43.7±53.5 |
AE |
67.9±111.2 |
86.3±85.1 |
133.3±128.8 |
42.6±37.8 |
|
REST |
91.0±32.9 |
92.6±26.4 |
96.5±10.9 |
91.1±11.4 |
|
ALL |
74.1±74.9 |
70.6±63.4 |
103.8±91.2 |
58.8±46.4 |
|
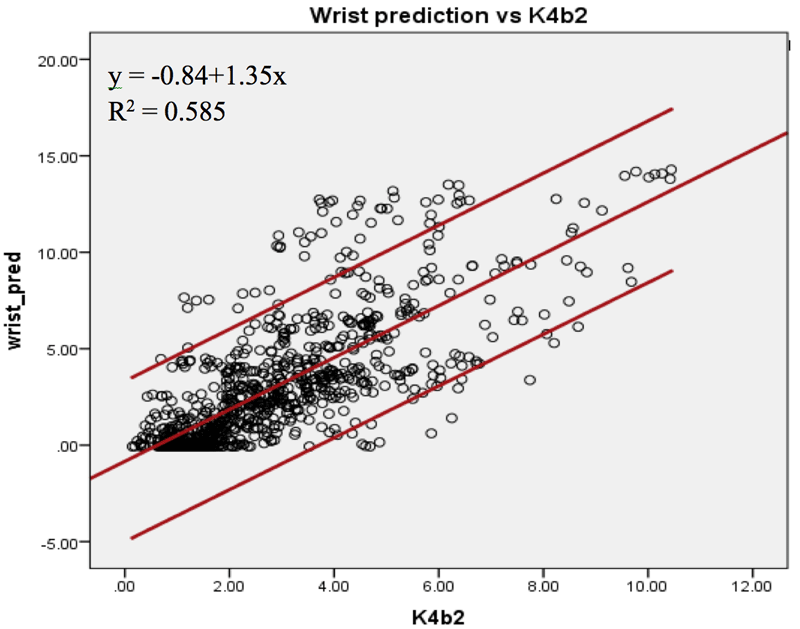
Figure 1a: The linear relationship between the criterion EE and the estimated EE by the wrist prediction models.
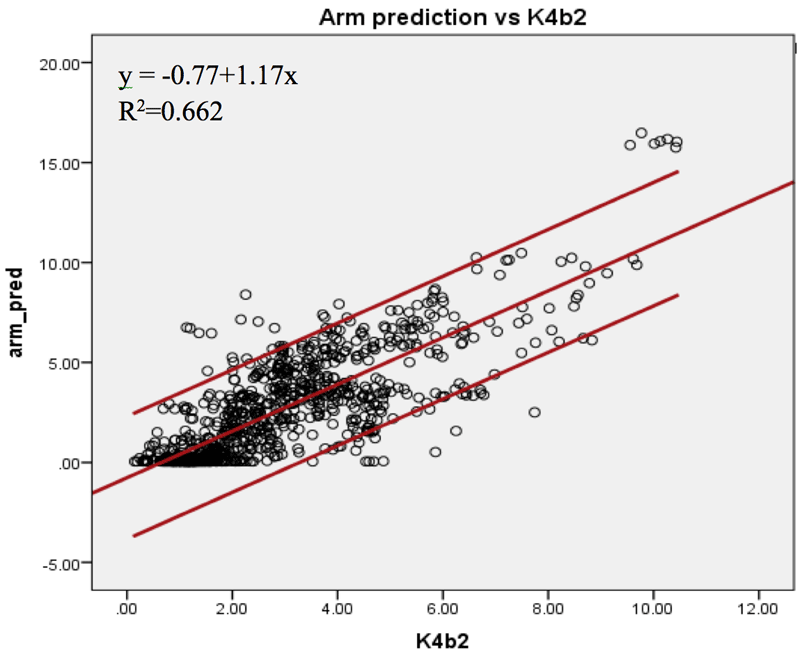
Figure 1b: The linear relationship between the criterion EE and the estimated EE by the upper arm (bottom) prediction models.
The Pearson coefficients of the predicted EE and the criterion EE at the wrist and upper arm were found. The EE estimated by the upper arm (r=0.81, SEE=1.56kcal/min) and the wrist (r=0.77, SEE=2.12kcal/min) prediction models showed high correlations with the criterion EE (Figure 1a & 1b). The agreement of the two prediction models was calculated. The EE estimated by both prediction models showed higher agreement with the criterion than the EE measured by the default models. The ICC (3, 1) was 0.862 [95% confidence interval (c.i.) 0.839 – 0.881] for the upper arm prediction model; while the ICC (3, 1) was 0.643 [95% c.i. 0.544 – 0.716] for the default model. The wrist prediction model showed ICC (3, 1) = 0.793 [95% c.i. 0.765 – 0.817]; while the default model showed ICC (3, 1) = 0.753 [95% c.i. 0.709 – 0.790]. The Bland-Altman plots were also constructed to illustrate the agreements of the two prediction models with the criterion EE (Figure 2a & 2b). For the wrist position, the mean difference between the EE predicted by the manufacture model and the criterion was -0.49 kcal/min [95% c.i. -4.61 – 3.63], and that between the EE predicted by the custom wrist model and the criterion was -0.11 kcal/min [95% c.i. -4.53 – 4.32]. For the upper arm position, the mean differences were -1.39 kcal/min [95% c.i. -9.10 – 6.32] and 0.31 kcal/min [95% c.i. -2.88 – 3.49] for manufacture model and custom upper arm model, respectively. The EE estimated by the upper arm prediction model showed the highest agreement with the criterion EE.
DISCUSSION
![Figure 2a: The Bland-Altman plot of the measured EE by the default model (top) and the wrist prediction model (bottom). ). For the wrist position, the mean difference between the EE predicted by the manufacture model and the criterion was -0.49 kcal/min [95% confidence interval -4.61 to 3.63], and that between the EE predicted by the custom wrist model and the criterion was -0.11 kcal/min [95% confidence interval -4.53 to 4.32].](tsang/fig2a.png)
Figure 2a: The Bland-Altman plot of the measured EE by the default model (top) and the wrist prediction model (bottom).
![Figure 2b: The Bland-Altman plot of the measured EE by the default model (top) and the upper arm prediction model (bottom). For the upper arm position, the mean differences between the EE predicted by the manufacture model and the criterion were -1.39 kcal/min [95% confidence interval -9.10 to 6.32], and that between the EE predicted by the custom upper arm model and the criterion was 0.31 kcal/min [95% confidence interval -2.88 to 3.49].](tsang/fig2b.png)
Figure 2b: The Bland-Altman plot of the measured EE by the default model (top) and the upper arm prediction model (bottom).
According to the MSE and the MAE, the EE estimated by the wrist and upper arm prediction models were better than the ActiGraph default manufacturer’s model; however, their performance was still poor (Table 1) when compared to the performance of the monitors in ambulatory population. The average MSE of commercial tri-axial activity monitors in ambulatory population was -6.85% [95% c.i. -18.2 – 4.49%], and none of the models evaluated in this study were comparable to that. In addition, both the wrist and upper arm prediction models overestimated the EE during wheelchair propulsion and arm ergometry exercises, but underestimated resting. It was clear that even the prediction models performed a little better for wheelchair propulsion than arm ergometry exercises and resting, the estimation error for propulsion remained high.
The inaccurate results we obtained could be due to the differences between study protocols used in our evaluation study and in the model development study conducted by Nightingale et al. (2014). Subjects in Nightingale et al. (2014) were asked to perform structured wheelchair propulsion (2, 4, 6, 8km/h) and deskwork (type out a script) (1); while our subjects performed resting instead of deskwork, and propulsion and arm ergometry exercise at self-selected speed and intensity. In addition, subject characteristics in our study are different from Nightingale et al. (2014). In Nightingale et al. (2014), 15 MWUs and 2 able-bodied subjects who were familiar with wheelchair propulsion were recruited for developing the models (1). The relatively small sample size was insufficient to build models that could be generalized to other MWUs, resulting in large estimation errors and variations. Although MWUs with spinal cord injury and spina bifida were recruited in both studies, Nightingale et al. (2014) also included MWUs with fibromyalgia and complex regional pain syndrome (1) while our study included an amputee. Furthermore, Nightingale et al. (2014) asked subjects only wear ActiGraph monitors on the right upper arm over triceps and wrist (1) while we put the devices on dominant side. Once we excluded the data collected from the left-handed subject, the overall MSE and MAE decreased by 5% and 20% respectively for both custom models.
Despite the inaccuracy of the custom models, the correlations of the EE predicted by the custom models were improved when compared to the EE estimated by the manufacturer’s default models. For the wrist position, the correlation between the estimated EE and the criterion EE were increased from 0.66 (SEE: 2.06kcal/min) to 0.77 (SEE: 2.12kcal/min), and for the upper arm position, it increased from 0.79 (SEE: 3.18kcal/min) to 0.81 (SEE: 1.56kcal/min).
Like Nightingale et al. (2014), many studies only used correlation to evaluate the performance of the monitors or custom models. While correlation might be helpful for researchers to improve the technology, it might not be as useful for real-world use. If a clinician wants to recommend a monitor to help a MWU to track PA for a weight loss program, a high correlation with the criterion measure does not suggest that a monitor would be able to accurately measure the energy spent each day. High validity is required for monitors to be used in clinical settings (5). A monitor that can accurately assess PA and EE in MWUs is important in assisting clinicians to evaluate their patients’ needs in getting suitable physical fitness interventions, track patients’ progress and compliance; and more importantly, it helps clinicians to evaluate the effectiveness of new interventions that aim at increasing PA to reduce the risk of developing secondary health conditions in MWUs, and facilitate dose-response research (5).
To improve the future development of monitors or custom models, expanding the sample size and including MWUs with various diagnoses will help increase the generalizability of the results. Having less structured experimental designs or less strict PA protocols may better reflect how the monitors are used by the MWUs in real life. Using data collected from free-living activities in MWUs may benefit the development of monitors for everyday use. Last but not least, the accuracy is a crucial indicator of how well commercial monitors or custom models can quantify PA in MWUs; reporting the percent error of the predicted EE against the criterion will assist clinicians in decision making and provide a standardized way for researchers to compare results across different studies.
CONCLUSION
Overall, both the wrist and upper arm prediction models developed by Nightingale et al. (2014) performed better in quantifying PA in MWUs than the ActiGraph default models; but none of the prediction models was as good as the ActiGraph’s performance in ambulatory population. Though, the estimated EE by both prediction models showed improved correlation and agreement with the criterion EE.
REFERENCES
2. 2020 HP. Physical Activity 2014 2014 [updated Jun 18 2014; cited 2014 Jun 18]. Available from: http://www.healthypeople.gov/2020/topicsobjectives2020/overview.aspx?topicid=33.
3. WHO. Noncommunicable diseases WHO Media centre: World Health Organization; 2013 [updated March 2013; cited 2014 June 16]. Available from: http://www.who.int/mediacentre/factsheets/fs355/en/.
ACKNOWLEDGMENT
The work is supported by RecTech (Grant: H133E120005) and the Department of Rehabilitation Science and Technology at the University of Pittsburgh. The contents do not represent the views of the organization, the department or the university.