An IoT Smart Home System for Activity Analysis
Christopher Coelho1, Sethu Chidambaram2, Marilyn Wolf2
1iTechTool, Los Altos Hills CA
2School of ECE, Georgia Institute of Technology, Atlanta GA
Abstract
We are developing an IoT smart home system for the analysis of activity of residents with special needs. The system is designed to use a variety of sensors to identify the daily activities of residents and to find patterns in their behavior. Identifying typical activity helps to maintain the records required for Medicaid and other agenices; identifying unusual behavior can help to spot issues quickly. We describe our event-driven IoT architecture and our computer vision approach to person detection and activity analysis.
Keywords
long-term care, special needs, Internet-of-Things
Introduction
Our system is designed to use a variety of home sensors to derive activity of the people in the house. Identifying typical activity helps to maintain the records required for Medicaid and other agenices; identifying unusual behavior can help to spot issues quickly. Many activity analysis systems concentrate on relatively short-lived activities such as cooking a meal or exercising. Our algorithms, in contrast, are designed to identify activity at multiple time scales ranging from minutes (cooking a meal) to years (winter behavior may differ from summer behavior).
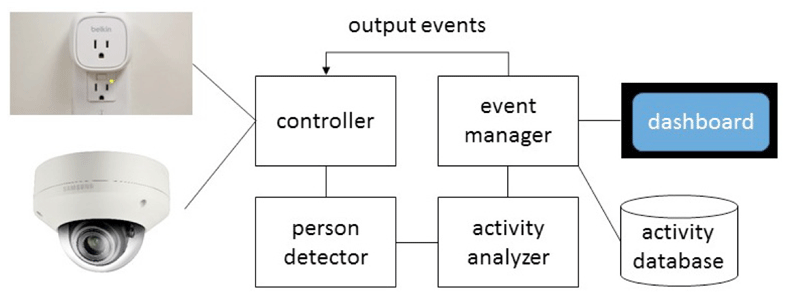
Figure 1 shows our system block diagram. Sensors are connected to a device manager that generates an event for each significant sensor reading. An event manager has two functions: it logs events in the activity database; and it schedules output events that are caused either by sensor activity (e.g., person enters a room) or by schedule (e.g., turn down lights for sleep). A computer vision system detects persons and analyzes their activity. A dashboard provides access to system information to both staff and residents.
We are collaborating with Imagine! Colorado to build and evaluate this system for their smart homes for Medicaid residents. The homes have a variety of sensors: electrical outlets, water taps, electric eyes on doors, and a limited number of cameras.
Both privacy and personal data access are guiding principles for our system architecture. On the one hand, we treat all sensor and derived information as medical information. Our system is designed to maintain privacy of data and to ensure that a user has access only to appropriate information---for example, the doctor of one resident may not necessarily be authorized to see information on another resident. On the other hand, residents have a right to their own data and information about their daily lives can be both useful and stimulating. We are designing the system so that residents and staff can easily obtain the information they need and want.
The next section describes our event management system. Section III describes our person detection system and overviews our activity analyzer. Section IV summarizes aspects of our sensing and computing platform.
Event Management System
BCS (Building Control System) is an open-source environment which provides centralized management of all events in an IoT environment. BCS has several important attributes:
- BCS provides an abstract representation of device events and state.
- It provides for modular device driver implementation and hiding of device specifics through high-level abstraction.
- Its software architecture provides for easy modular development of management and monitoring functions that can operate without knowledge of device details.
- It is scalable and supports complex environments with tens of thousands of device interfaces and real-time event processing.

BCS maintains the state of every device input/output with a simple variable id/state value pair. For example, for an analog temperature sensor input, the current value could be stored as variable named 'temp_office' and the value could be '73.2'. As the sensor detects changes in the temperature, the device driver will update the BCS database to reflect these new values. For an output, such as a dry-contact relay, a variable such as 'door_latch' might have values of '1' for open and '0' for closed. The device driver for this latch will poll the variable value and when a change is detected will update the latch state.
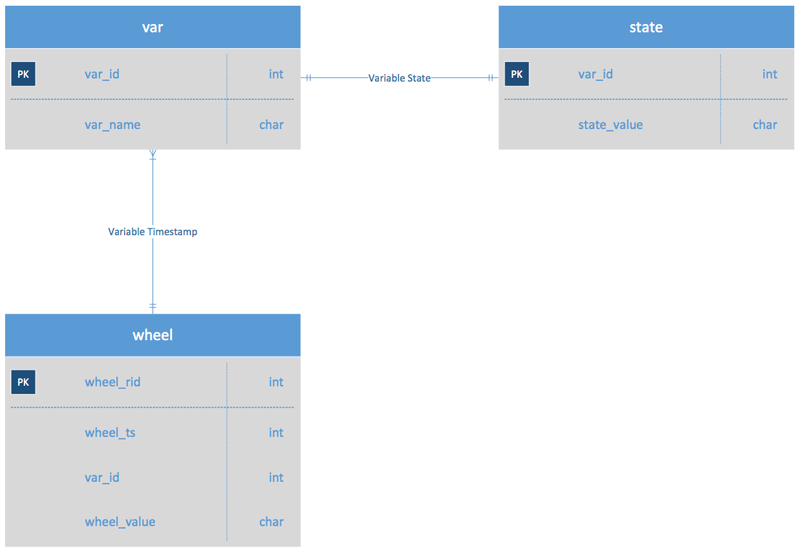
Figure 4 shows the entity-relationship for the BCS database as follows:
- a 'state' table which contains the current state for every variable id associated with all device I/O points
- a 'wheel' table which contains a time-sequenced record of variable id/state values over typically a 10 minute time window
- a 'var' table which is used to map internal variable id to a user friendly variable name
The following illustrates a typical sensor trip sequence in BCS:
- a door is opened, opening the associated magnet/dry-contact input to Koyo DL205 PLC
- the Koyo device driver detects the input change, and updates the BCS database by setting a new value for the 'contact_bedroom' variable to '0' which represents and open door
- a monitoring process polls the BCS database and detects a change in the 'contact_bedroom' variable from 1 to 0, and consequently updates additional variable values such as setting the 'light_bedroom' value to 1 (which triggers the bedroom light to turn on).
The following illustrates use of the BCS FIFO:
- A Lutron Homeworks lighting system detects a keypad press, the lutron device driver creates an entry in the BCS 'wheel' table for variable 'keypad_bedroom' with value '4' (key 4 on keypad).
- A monitoring process polls the 'wheel' table looking for all keypad presses in the past 2 seconds, and detects the bedroom key 4 press. The monitoring process then sets the BCS variable 'latch_frontdoor' to 1, waits 8 seconds, then sets the value back to 0.
- The device driver process for the Koyo DL205 PLC detects the variable 'latch_frontdoor' setting to 1, and closes a dry contact which applies 24VDC to the door latch, then 8 seconds later detects the change back to 0, and opens the dry contact which removes the 24VDC from the door latch.
Person Detection and Activity Analysis
Our system is designed to analyze the activity of residents continuously and unobtrusively. The system does not require labeling of events or pre-defined models of the types of activity to be detected. Activity analysis is performed using data from all sensors in the house. We refer to cameras as appearance-bearing and other types of sensors, such as power outlet sensors, to be non-appearance-bearing. We can also use input from users through the dashboard as input events. Our algorithm can identify traces of a person’s activity through the house through inference from a combination of non-appearance-bearing and appearance-bearing events.
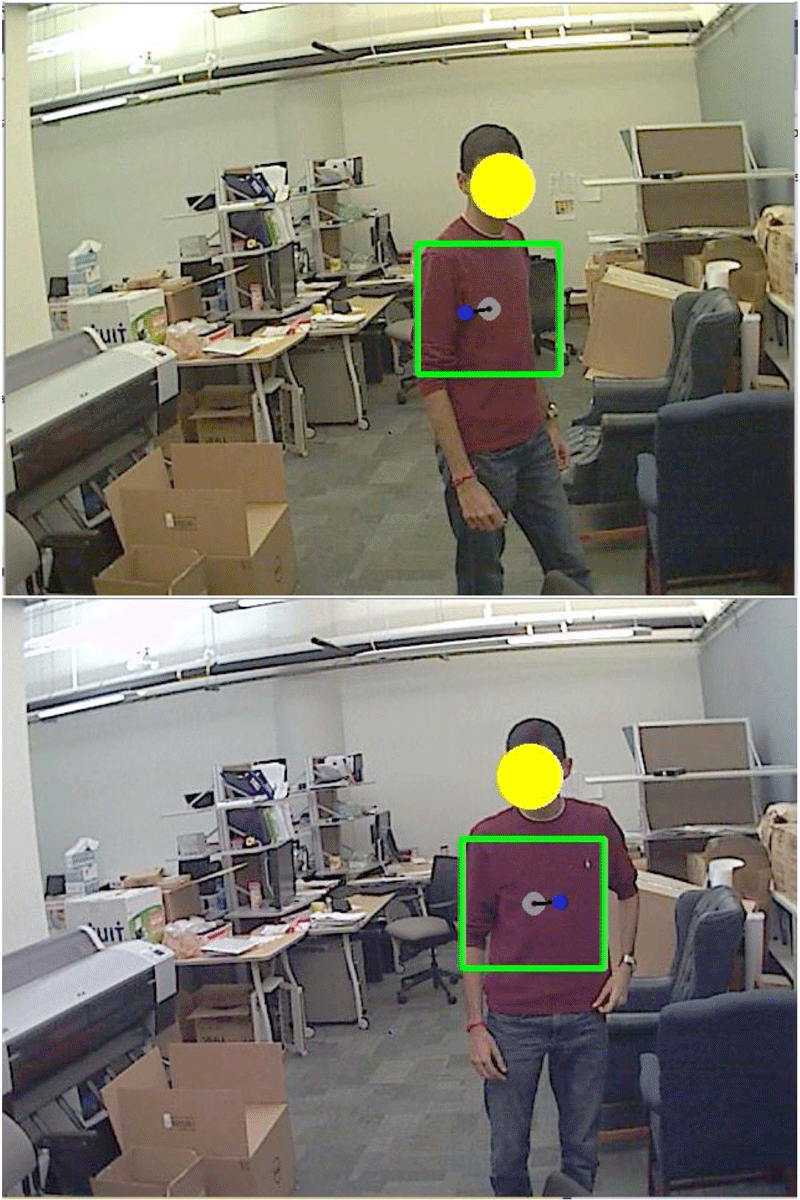
- Time of the observation.
- Location of the observation.
- Appearance of the subject in the form of bounding box dimensions and a color histogram.
- Direction of travel---the sides from which the person entered and left the frame.
Our activity analysis algorithm uses a Bayesian model of event relationships to infer activity [1,2]. A graph model describes the structure of the home, the positions of sensors, and the possible paths between sensor locations.
We use Markov chain Monte Carlo (MCMC) algorithms to solve the set of event relationships. The algorithm partitions a set of observation events into tracks, one for each resident.
Platform Architecture
As mentioned in Section I, our target smart homes make use of a variety of sensors that measure both indirect activity (water usage, power usage) and presence of a person (electric eyes, cameras. The Imagine! homes use Kenko device controllers to interface to the IoT devices. The sensors in the homes make use of a variety of technologies; IoT systems must be able to handle legacy interfaces as well as more modern wireless interfaces.
We use a computing platform for development convenience: BCS runs on Linux while the person detector and activity analyzer run on Windows. Over the long run we expect to re-engineer the code to run on a single platform in order to make the system easy to install and maintain for relatively unsophisticated users.
Conclusions
People with special needs require long-term care, delivered by a combination of family members and paid staff. Care is demanding and time-consuming. Smart home systems can help to identify concerns on the condition of residents and to help generate documentation required by Medicaid. We are building a system that leverages low-cost sensors and powerful algorithms to analyze and monitor residents over multiple time scales.
References
- Honggab Kim and Marilyn Wolf, “Distributed tracking in a large-scale network of smart cameras,” in Proceedings of the Fourth ACM/IEEE International Conference on Distributed Smart Cameras, ACM Press, 2010, pp. 8-16.
- Marilyn Wolf, Mihaela van der Schaar, Honggab Kim, and Jie Xu, “Caring analytics for adults with special needs,” IEEE Design & Test, 32(5), October 2015, pp. 35-44.
Acknowledgments
We are grateful to Kevin Harding and Greg Wellems of Imagine! Colorado for their collaboration and inspiration.