DEVELOPMENT OF DISTANCE EDUCATION ACCESSIBILITY RESEARCH TOOLS
Jacqueline M. Love, BS
Carly Golden, BS
Roger O. Smith, PhD, OT, FAOTA, RESNA Fellow
University of Wisconsin Milwaukee, R2D2 Center
ABSTRACT
Disability prevalence in post-secondary institutions is on the rise, with estimates almost quadrupling in the last 40 years. This diversifying student body will not always benefit most from traditional teaching methods, yet little research has been done to identify and evaluate Universal Design Instruction (UDI) in newer methods of instruction, such as Distance Education (DE). The research tools developed in this project serve to help future researchers effectively and accurately identify successes and barriers in technology-based education for students with disabilities. These survey tools were designed to identify and assess demographic information, course demands and accessibility interventions. They are intended to facilitate more relevant research in accessibility to improve the DE experience for all students, including those with disabilities.
introduction
The population of students with disabilities (SWDs) in postsecondary education is often hidden and thus, very little is known about how effective our teaching methods are for this group. In 1978, studies showed that full-time students with disabilities at the postsecondary education level was only 2.6%. In 2011, this number was up to 11.3% and other studies suggest that as much as 60% of students with disabilities do not disclose their disabilities to their universities or professors. This which would indicate that the percentage of the student population with some type of disability could be as much as 18-20% (Roberts, 2011).
This increasingly varied student body often has different learning needs than provided by traditional instructional methods. In order to meet these needs, educational systems have started incorporating more and more technology into educational methods. The efficiency and availability of technology has resulted in an integration of distance education (DE) in the postsecondary education system.
Increased educational technology is beneficial for the inclusion of a more diverse population and can allow for people with physical, psychological, and environmental barriers to participate more effectively in education. However, increased technology implementation in education does not automatically result in more effective and universal education. In fact, one study indicated that in spite of growing access to technology and therefore, education, students with disabilities are still less likely to earn a degree than their non-disabled peers (Schelly, 2011). According to a study by the national council of disability, only 6% of US students with disabilities ages 21-64 are able to complete college and receive their bachelor’s degree (Zimmer, 2012).
Moreover, as educational technology and online education advance, the field needs effective research and new research tools to facilitate implementation. Research in the field of distance education in relation to underrepresented disabilities is currently alarming limited. The problem is not that an interest in DE and SWDs doesn’t exist but more so that this subject is one of a complex nature. Generic educational researchers, even when they have interest to understand the effects of their DE on SWDs, do not understand the variables relevant to research that is inclusive of students with disabilities. Therefore, in order to assist educational researchers examine the relationships that exist between distance education and students with disabilities, we have created a suite of data collection tools in the form of Qualtrics surveys to guide research. The trek to the current incarnation of these research tools, however, has been arduous. We describe the overall background and development of these data collection instruments here.
Methods
Conceptualization
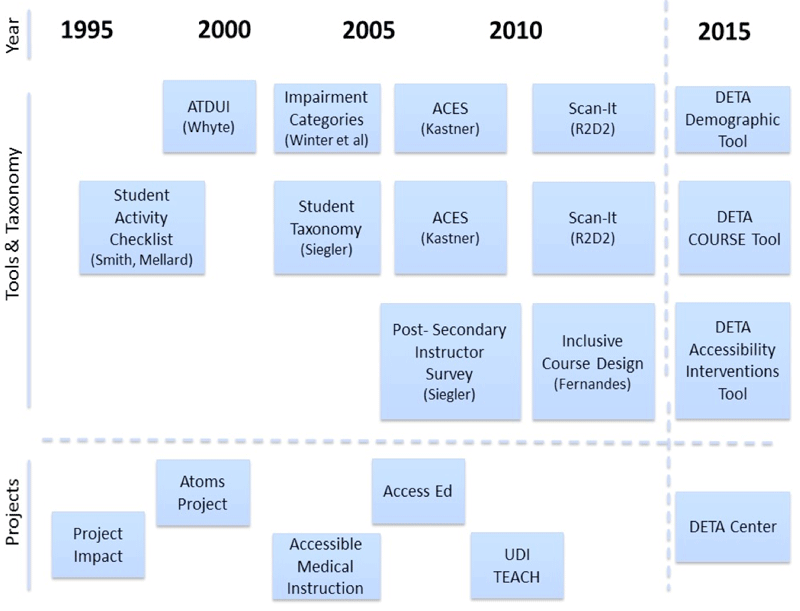
Considerable work in educational accessibility assessment has been performed at the R2D2 Center over the years. Since 1998, R2D2 has published 9 research studies and created numerous evaluative tools in the field of education and disability. Each UDI and Disability research project completed by R2D2 created a taxonomy which built on the information learned from past studies while incorporating new research. These previously validated taxonomies and research tools were utilized in the creation of the DETA project taxonomies. From these, it was possible to create a minimal data set for each tool. A multi-decade timeline of R2D2 research related to UDI and disability is portrayed in Figure 1.
Up to this point, this research has been approached from a student or teacher perspective. The tools that have been created in past studies have served to evaluate current practices in categories such as classroom accessibility, EqTD, and test accessibility in order to help students prepare and plan for classroom expectations as well as help teachers to think about universal design in education and the general accessibility of their course. For DETA, the target audience shifted to future researchers.
Development
The National Distance Education and Technological Advancement (DETA) Center at the University of Wisconsin-Milwaukee was created in 2013 to promote student access and success through evidence-based distance education, especially for underrepresented populations, such as SWD. The R2D2 Center works in conjunction with the DETA Center to create tools to help prompt educators and researchers examine the relationships that exist between UDI and Disability and tease out not only what is effective, but what is not, for students with disabilities.
Validation
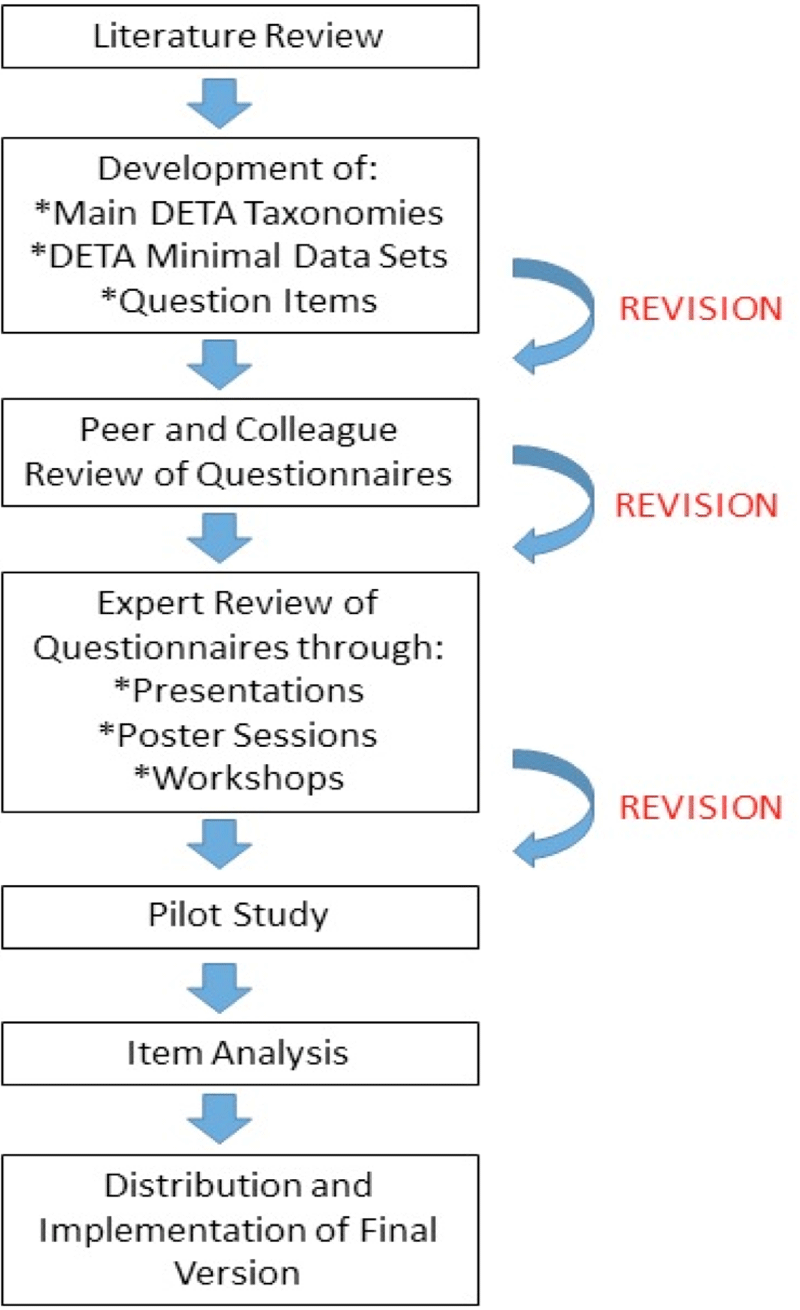
In order to enhance face and content validity of the tools, we first sought feedback on content and usability from staff and colleagues. Revisions were made based on that feedback. We then actively sought feedback from experts in the fields of higher education and disability through personal request, the presentation of our constructs at poster sessions and conferences, and through expert focus groups at workshops. This feedback resulted in additional revisions of the original wording and formatting of questions to ensure that all items were targeting the intended concepts. Early versions of the surveys were also tested to ensure that the skip logic embedded in the surveys worked as they were intended.
The full development process from conception to distribution is outlined in figure 2.
Results
The completion of the product development phases resulted in three Qualtrics surveys that focused on demographics, course requirements, and accessibility interventions.
Student Demographics
I have a functional impairment that falls into one or more of the following categories: (Check all that apply)
|
The student demographics tool is a three part tool that addresses Diagnoses, Functional Impairments, and Student Technology Usage. Together, these tools work to gather demographics information about the students in the course. Taxonomies in previous research demonstrated need for a detailed three-part demographics questionnaire in order to identify all students who we qualify as part of the disabled population. Studies show that many students with disabilities do not consider themselves disabled, especially those with cognitive and learning impairments. This is a large reason why disability in postsecondary education is so vastly underrepresented in statistics.
The first part of this tool, The Student Demographics: Diagnoses Tool specifically focuses on demographic information regarding diagnosed conditions of the students. The first question of this tool serves to identify whether the student has a diagnosis that pertains to any of the following categories: sensory disorder, cognitive disorder, learning disorder, behavioral disorder, systemic condition, mobility or orthopedic disorder, communication disorder, other, or none.
The Student Demographics: Functional Impairments Tool looks specifically at functional impairments that have the potential to create barriers to the student’s learning. Similarly to the Diagnosis Tool, this tool begins by identifying whether the student has a cognitive, sensory, behavioral, or motor impairment. This section is less concerned with formal diagnoses and more concerned with what tasks the student feels as though they struggle with (or tasks that they have been told they struggle with).
Lastly, the Student Demographics: Student Technology Usage Tool inventories the assistive technology devices and systems that a student may be using to help them succeed in an educational environment. In a similar fashion to the first two demographic tools, this tool also starts by identifying whether a student uses a communication aid, computer access aid, hearing and listening aid, mobility and transportation aid, prosthetic and orthotic aid, vision and reading aid, other or none.
Accessibility Interventions
| Time Flexibility & Planning | |||||
| Readily available | Sometimes available | Not available | This is not appicable to my course | Do not know | |
| General | |||||
| Option to test out of material instead of having a set structure of assignments | |||||
| Option to complete the course at your own pace | |||||
| Enough time to complete tests (2-3 times the amount of time needed) | |||||
| Delivery of information | |||||
| Course materials were provided as needed, not all at once. | |||||
All of he cours materials were provided at the beginning of the course & you could self-pace the material. |
|||||
| Flexibility in Due Dates | |||||
Accommodations for unplanned circumstances were available. |
|||||
| Deadline extensions were available. | |||||
The Accessibility Interventions Tool seeks to identify whether the course has interventions/adaptations available to provide additional assistance to students. This questionnaire was split into nine sections including: Time Flexibility & Planning, Group & Social Support, Dexterity Task Alternatives, Syllabus Accessibility, and the availability of Accommodations for Instructions, Static Visual Media, Cross Media Types, General Visual Media, and Auditory Media. All questions were on a Likert-like scale from not available to readily available with N/A and Do Not Know as other possible answer options.
Course Objectives and Underlying Requirements for Successful Evaluation (COURSE)
The COURSE Tool is an eighteen item questionnaire that works to identify what activities were completed/required as a part of the course and prevalent the activities were in the course. Response options were on a Likert-like scale with six possible options describing the frequency of a given activity. These options ranged from rarely/very little to constantly/a lot and included a N/A option for courses were an activity was not present.
Discussion
This project is currently in a testing phase of development. Now that there is agreement on the concepts between the experts, these tools need to be validated externally. Outside users will help us to continue to validate the content as well as get information the positives and negatives associated with the wording and structure of our tools. Completion of the current pilot study will give us more information on survey items and help us to make any final revisions. A visual of the full methodology can be seen in figure 3.
Evidence-based research in the field of UDI and Disability is relatively untapped which creates a demand for these types of studies. As a result, tools to help make these studies easier to complete would be helpful in populating databases on this topic. Thus far, experts and students have found the tools presented in this paper to be a comprehensive, efficient, and straightforward way to evaluate student demographics, course requirements, and course accessibility for a given postsecondary education course. Further testing and subsequent revisions are planned to improve the usability of these tools and document validate their intended use.References
Bowe, F. (2000). Universal design in education: Teaching nontraditional students. Greenwood Publishing Group.
Farr, B., Studier, C., Sipes, L., & Coombs, N. (2008). A Needs Assessment of the Accessibility of Distance Education in the California Community College System. Part I. MPR Associates, Inc.
National Council on Disability. (2008). Keeping track: National disability status and program performance indicators. Washington, D.C., from http://www.ncd.gov/newsroom/publications/2008/pdf/Indicators_Report.pedf
Roberts, K. D., Park, H. J., Brown, S., & Cook, B. (2011). Universal Design for Instruction in Postsecondary Education: A Systematic Review of Empirically Based Articles. Journal of Postsecondary Education and Disability, 24(1), 5-15.
Schelly, C. L., Davies, P. L., & Spooner, C. L. (2011). Student Perceptions of Faculty Implementation of Universal Design for Learning. Journal of Postsecondary Education and Disability, 24(1), 17-30.
Zimmer, M. A. (2012). Universal Design in Higher Education: From Principles to Practice–Edited by Sheryl E. Burgstahler and Rebecca C. Cory. Teaching Theology & Religion, 15(1), 89-91.
ACKNOWLEDGEMENTS
The National Research Center for Distance Education and Technological Advancements (DETA) is supported in part by the U.S. Department of Education's Office of Postsecondary Education, PR/Award #P116Q140006. The opinions contained in this proposal do not necessarily represent the policy of the Department of Education, and you should not assume endorsement by the Federal Government.