EVALUATION OF SHOULDER JOINT KINEMATICS AND STROKE CYCLE CHARACTRESTICS DURING GEARED AND STANDARD MANAUL WHEELCHAIR MOBILITY
Omid Jahanian, Alyssa J. Schnorenberg, Lianna Hawi and Brooke A. Slavens
Department of Occupational Science & Technology, University of Wisconsin-Milwaukee, Milwaukee, WIABSTRACT
Geared manual wheelchairs may be a promising alternative for standard manual wheelchairs that reduce the biomechanical demands of the upper extremity joints, while maximizing function and participation. To investigate the effects of geared manual wheelchair mobility during demanding tasks such as ramp ascending, six able-bodied subjects were evaluated in this study. Subjects were asked to perform level and upslope stroking tasks using both standard and geared manual wheelchairs. Stroke cycle characteristics and shoulder joint kinematics were investigated. The results indicated that using geared manual wheelchair wheels did not alter the glenohumeral joint kinematics, but caused significant changes in stroke cycle characteristics particularly during demanding tasks such as ramp ascent. These results could have clinical implications for determining the types of mobility tasks and populations of users for which geared manual wheelchair are beneficial. The results from this work will also help improve the current geared wheel design and develop new multi-geared wheels for manual wheelchairs.
BACKGROUND
Manual wheelchairs often lead to reduced independent function (Van der Woude, 2005) and an increase in shoulder pain and injuries (Alm, 2008). Geared manual wheelchairs may be a promising alternative that reduce the biomechanical demands of the shoulder needed for demanding tasks such as propulsion on ramps and carpeted floors, while maximizing function and participation. Previous work by our group showed that glenohumeral (GH) joint kinematics in all three planes of motion were not significantly different between geared wheels and standard wheels during level propulsion on tiled and carpeted floors, but stroke frequency increased significantly during geared mobility (Jahanian, 2015). Electromyography (EMG) of shoulder muscles during level stroking and upslope stroking, has shown a significant decrease in shoulder muscle activity during geared manual wheelchair mobility (Howarth, 2010). Shoulder pain reduction among manual wheelchair users was also reported as one of the potential advantages of geared manual wheelchair mobility (Finley, 2007). However, there is still limited scientific evidence supporting the benefits of geared manual wheelchair mobility. The goal of our work is to elucidate the biomechanical mechanisms affected by geared manual wheelchairs.
PURPOSE
The purpose of this study was to compare the upper extremity joint kinematics and stroke cycle characteristics during level stroking and upslope stroking when using geared and standard manual wheelchairs. Using a repeated measure design, we aimed to address the following research questions:
- Does wheel type cause significant changes in stroke cycle characteristics and shoulder joint kinematics?
- Does slope cause significant changes in stroke cycle characteristics and shoulder joint kinematics?
METHOD
Subjects
Six individuals, three females and three males, ages 20-23 were recruited for this study. All participants were able-bodied and had no prior wheelchair experience. This study was approved by the University of Wisconsin-Milwaukee institutional review board (IRB). Prior to data collection, each participant read and signed an informed consent document. An acclimation period (15-30 min) was provided for the participants to become familiarized with wheelchair propulsion techniques.
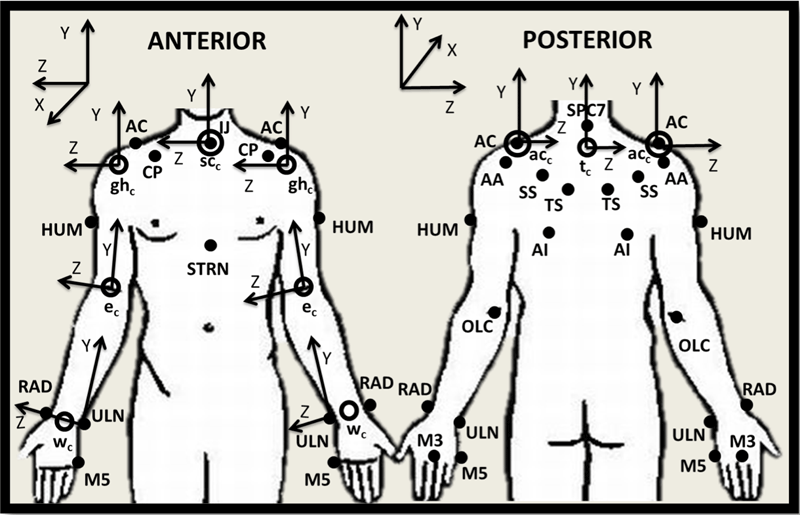
Data Collection
Data Processing
To identify the push and recovery phases of each propulsion stroke, sagittal kinematics of the marker placed on the third metacarpal was used. The three critical instants were the first initial hand contact (HC1), hand release (HR) and the second initial hand contact (HC2). Push phase was defined as HC1 to HR and a complete stroke was from HC1 to HC2. Temporal parameters (stroke time, push time expressed as percentage of stroke time and stroke frequency) were determined using the frame numbers and intervals between consecutive frames (1/120 s). Stroke distance was computed as the distance between the location of the wheel center at HC1 and at HC2. Stroke speed was calculated by dividing the stroke distance by the stroke time. Normalized stroke frequency was obtained by dividing the stroke frequency by the stroke distance. For the ramp trials, the stroke when the wheelchair castors passed the midpoint of the ramp, and for the level stroking trials, the forth stroke were selected from each trial for analysis. The method used for determination of stroke cycle characteristics was constant with the approach defined by Chow and colleagues (Chow, 2009).
A custom inverse dynamics model (Schnorenberg, 2014) was used to calculate the 3-D upper extremity (UE) joint dynamics. The results for GH joint (humerus relative to thorax) in all three kinematic planes (sagittal, coronal and transverse) were used for analysis.
Data Analysis
Mean and standard deviation of stroke cycle characteristics and GH joint kinematics were computed for each wheel type (standard / geared) and slope (level-floor / ramp). A two-way analysis of variance (2 wheel x 2 slopes) with repeated measures was used for statistical analysis. If there was no significant interaction between the factors, main effects were investigated using Bonferroni adjusted t-test. When there was significant interaction between factors, simple effects of wheel factor within each each level of slope were examined. All statistical analyses were completed with IBM SPSS software using general linear model repeated measure (significance level = 0.05).
RESULTS AND DISCUSSION
Stroke Cycle Characteristics

standard wheel conditions, but during upslope stroking normalized stroke frequency increased significantly (49%, p = 0.05) during geared manual wheelchair mobility. The results for normalized stroke frequency indicated that for travelling the same distance a higher number of strokes is required while using geared manual wheelchairs.
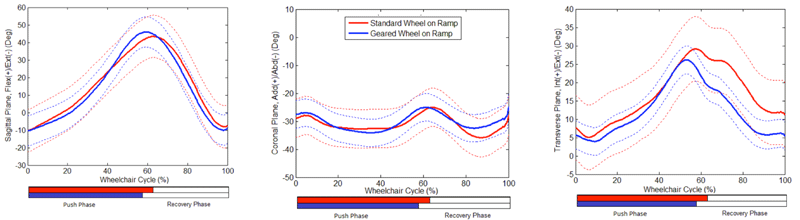
GH Joint Kinematics
There was no significant interaction between the factors (wheel and slope), and GH joint kinematics of six subjects were not significantly different between geared wheels and standard wheels. GH joint angle mean ranges of motion in the sagittal, coronal and transverse plane are presented (Table 2). Figure 2-3 illustrate the kinematic trajectories of GH joint in three planes and for geared and standard manual wheelchair during upslope stroking and level stroking.
Study Limitations
Small sample size and testing able-bodied subjects instead of experienced manual wheelchair users were the main limitations of this study. Further investigation is underway with a larger population of able-bodied persons and manual wheelchair users with spinal cord injury.
CONCLUSION
Previous studies on geared manual wheelchair mobility had reported potential benefits in terms of muscle activity and pain reduction. The results of this study showed that using the geared manual wheelchair did not alter GH joint kinematics, but it caused significant changes in stroke cycle characteristics particularly during demanding tasks such as ramp ascent. The significant increase in number of required strokes for travelling a specific distance can be the main drawback of geared manual wheelchairs. The results from this study have clinical implications for development of manual wheelchair prescription guidelines. These results will help us determine the types of mobility tasks and populations of users for which geared manual wheelchairs are beneficial. Ultimately, this work will lead to new multi-geared wheel designs for manual wheelchairs.REFERENCES
Alm, M., Saraste, H., & Norrbrink, C. (2008). Shoulder pain in persons with thoracic spinal cord injury: prevalence and characteristics. Journal of rehabilitation medicine, 40(4), 277-283.
Chow, J. W., Millikan, T. A., Carlton, L. G., Chae, W. S., Lim, Y. T., & Morse, M. I. (2009). Kinematic and electromyographic analysis of wheelchair propulsion on ramps of different slopes for young men with paraplegia. Archives of physical medicine and rehabilitation, 90(2), 271-278.
Finley, M. A., & Rodgers, M. M. (2007). Effect of 2-speed geared manual wheelchair propulsion on shoulder pain and function. Archives of physical medicine and rehabilitation, 88(12), 1622-1627.
Howarth, S. J., Pronovost, L. M., Polgar, J. M., Dickerson, C. R., & Callaghan, J. P. (2010). Use of a geared wheelchair wheel to reduce propulsive muscular demand during ramp ascent: Analysis of muscle activation and kinematics. Clinical Biomechanics, 25(1), 21-28.
Jahanian, O., Schnorenberg, A. J., Hawi, L., & Slavens, B. A. Upper extremity joint dynamics and electromyography (EMG) during standard and geared manual wheelchair propulsion, Proceeding of the 39th Annual Meeting of American Society of Biomechanics, Columbus, OH.
Schnorenberg, A. J., Slavens, B. A., Wang, M., Vogel, L. C., Smith, P. A., & Harris, G. F. (2014). Biomechanical model for evaluation of pediatric upper extremity joint dynamics during wheelchair mobility. Journal of biomechanics, 47(1), 269-276.
van der Woude, L. H., & de Groot, S. (2005). Wheelchair propulsion: a straining form of ambulation. Indian Journal of Medical Research, 121(6), 719.