Upper Extremity Rehabilitation Analysis of Children with Cerebral Palsy Using Posterior Walkers
ABSTRACT
Walkers are used for rehabilitative efforts for children with cerebral palsy. They provide a means for patients to increase their ambulatory potential. Because the biomechanics of using walkers have not been fully quantified, it is important to analyze the patients' walker interaction to improve rehabilitation efforts. The purpose of this study is to characterize upper extremity (UE) motion in 25 children with spastic diplegic cerebral palsy (CP) who use posterior walkers for ambulation. Results indicate that there is a slow walking speed and a high heart rate associated with posterior walker usage. A repeatable UE joint movement pattern at the shoulder, elbow, and wrist is also seen. The morphology of the joint kinematics is described.
KEYWORDS
Cerebral palsy; kinematics; rehabilitation; upper extremity; walker
BACKGROUND
Cerebral palsy (CP) is a condition characterized by a motor disorder that is usually diagnosed during the early stages of life. It occurs from brain damage and has symptoms including postural instability and abnormal muscle tone. The Centers for Disease Control and Prevention (CDC) estimate that 10,000 children in the United States develop CP each year (1). A large number of patients with CP have spastic diplegic cerebral palsy, in which the disorder affects the lower extremities more severely than the upper extremities, and many use walkers. However, walker prescription tends to be very subjective. It is typically done by visual assessment without quantitative results or guidelines to follow. Because children with spastic diplegic CP are asymmetric in terms of extremity involvement, it is even more difficult to prescribe the optimal walker in terms of how the walker is affecting the child biomechanically. Therefore, for rehabilitation purposes, it is important to study the effects of walkers on children with CP.
To start this analysis, we present an upper extremity (UE) motion analysis system which allows us to complete the goal of analyzing UE motion of children with spastic diplegic CP who use posterior walkers for ambulation. Eventually, we hope to develop a quantitative method for prescribing walkers to children with CP, so that children with CP can obtain the walker which best suits their rehabilitative needs.
RESEARCH QUESTION
To date, there is no quantitative characterization of UE kinematics in subjects using walkers. This study reports quantitative measures of UE kinematics in 25 children with cerebral palsy, who routinely utilize a posterior walker for ambulation. Ultimately, analysis of the UE dynamics may lead to improved methods for walker prescription and modification.
METHODOLOGY
The multi-center study (Shriners Hospital for Children, Chicago, and the Medical College of Wisconsin, Milwaukee) employs the use of 12 and 15 camera Vicon motion analysis systems. An anatomically specific marker set and unique UE kinematic model is used to determine the angular joint rotations (2).
Testing for each subject consists of two motion analysis visits with a one month interval between visits. Following informed consent subjects undergo gait analysis and physical examination, which involves a heart rate monitor test, and Gross Motor Function Measure (GMFM). An acceptable gait cycle is defined by foot strike to ipsilateral foot strike (3) with no marker dropout. If the subject is physically unable to perform 5 gait cycles, s/he performs as many as s/he is capable of.
To date, 25 patients (aged: 12.08 ± 3.15 years) have been tested. To characterize motion, the method of fitting a Fourier series to the kinematic data was used (4). By use of the least squares method, we fit our data to the linear model:
![]()
where Y ij = the data for the i th % of a cycle and the j th trial, f = max no. of terms for the model set by R 2 analysis, and a 0 , a l , b l = constants.
From this model, predicted values at each percentage of the gait cycle were determined for each patient. A paired-sampled t-test and Wilcoxon signed rank test was done to check for significant differences between the laterality of segments.
RESULTS
Physical Examination
| Units | Mean | Std. Dev. | |
|---|---|---|---|
Resting Heart
Rate |
beats/min | 93.76 | 15.46 |
Walking Heart
Rate |
beats/min | 141.26 | 17.15 |
Walking Speed |
m/min | 26.43 | 13.78 |
Energy Expenditure
Index |
beats/m | 2.74 | 2.87 |
Heart Rate Monitor : Heart rate monitor results indicate that the average resting heart rate is 93.76 beats/min and the average walking heart rate is 141.26 beats/min. The average travel speed is 26.43 meters/min, with an average energy expenditure index value is 2.74 beats/meter.
GMFM : The GMFM results indicate that the average Standing Assessment Score (SAS) is 28.16 ± 8.69 and the average Walking, Running, and Jumping Assessment Score (WRJAS) is 34.88 ± 11.59.
| Mean | Std. Dev. | |
|---|---|---|
| Standing Assessment | 28.16 | 8.69 |
| Walking, Running, Jumping Assessment | 34.88 | 11.59 |
Gait Analysis
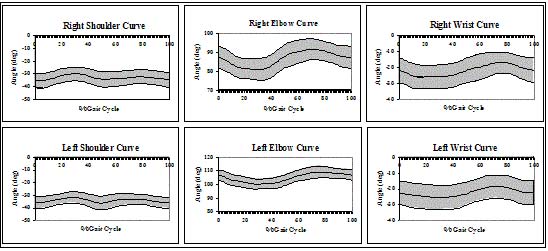
Shoulder : Joint kinematic and statistical model results indicate that during the average posterior walker sagittal plane motion, both the right and left shoulders are in extension. The shoulder angle using the posterior walker averages between 30-35º on the right side with a 95% confidence interval (CI) ranging between 24-41º. On the left side, the shoulder angle is between 31.5-36º with a 95% CI ranging between 27-41.5º. Elbow : Both the right and left elbows for a posterior walker user are in flexion. The right elbow angle averages between 82-92º with a 95% CI ranging between 75-98º. The left elbow angle averages between 101-109º with a 95% CI ranging between 97-113º. Wrist : Right and left wrists for both walkers are in extension. The wrist angle averages between 18-25º on the right side with a 95% CI ranging between 11-33º. On the left side, the wrist angle averages between 18-25º with a 95% CI ranging between 11-33º. The sagittal plane data (mean ± 95%CI) is shown in Fig. 1.
 |
DISCUSSION
Physical Examination
The average resting heart rate is on the high side of what a normal resting heart rate should be (60-80 beats/min) according to the American Heart Association (AHA) (4). The average walking heart rate is also on the high end of what the AHA suggests. According to the AHA, the average target heart rate for a 12 year old should be between 104 and 156 beats/min (5). Also, the average walking speed is much lower than the walking speed for a normal child (normal: 68.4 m/min for children ages 7-13) (6).
Gait Analysis
Shoulder motion exhibits four peaks ( P 1 -P 4 ) during each cycle. Greatest extension is seen during initial contact at 4% of the gait cycle (GC) on the right side and 0% of the GC on the left side; and during terminal stance/pre-swing at 52% of the GC on the right and 49% of the GC on the left side. Least extension is seen during mid-stance at 30% of the GC on the right side and 28% of the GC on the left side; and during mid-swing at 78% of the GC on the right side and 73% of the GC on the left side. Elbow and wrist motion exhibits two peaks ( P 1 , P 2 ). Subjects have the least flexion during mid-stance at 30% of the GC on the right side and 29% of the GC on the left side; and the greatest elbow flexion during initial/mid-swing at 71% of the GC on the right side and 76% of the GC on the left side. At the wrist, subjects have the greatest extension during mid-stance at 16% of the GC on the right side and 29% of the GC on the left side; and the least extension during mid-swing at 76% of the GC on the right side and 72% of the GC on the left side.
REFERENCES
- Schendel, D. E., Schuchat, A., and Thorsen, P. (2002, February). Public health issues related to infection in pregnancy and cerebral palsy. Ment. Retard. Dev. Disabil. Res. Rev., 8(1), pp. 39-45.
- Baker, K. M., Long, J. T., Hassani, S., Lipsey, J., Reiners, K., & Olson, W., et al. (2003, May). Walker Assisted Gait in Children with Cerebral Palsy: Instrumentation and System Design. Proceedings of Gait and Clinical Movement Analysis Society, 8, 163-164.
- Perry, J. (1992). Gait Analysis: Normal and Pathological Function. Slack Inc. New York: NY. pp. 11-16.
- Klein, J.P. (1997). Statistical Issues in Randomized Trials in Motion Analysis. Proceedings of IEEE Engineering in Medicine and Biology Society, 19.
- http://www.americanheart.org , 12/03.
- Rose, J., and Gamble, J. (1994). Human Walking. Williams and Wilkens. Baltimore: MD.
ACKNOWLEDGMENTS
This project is supported by NIDRR grant H133G010069.
Author Contact Information:
Kelly M. Baker, Academic Support Facility,
105 OREC, P.O.
Box 1881,
Milwaukee, WI 53201-1881,
Office Phone (414) 805-7456,
EMAIL: kelly.baker@mu.edu