Group Differences in Psychosocial Influences of, Satisfaction with and Knowledge of Mobility Devices
ABSTRACT
Differences among community-dwelling mobility device users (n=130) in their satisfaction with, knowledge of, and psychosocial response to assistive technology (AT) are compared in this report. The types of mobility devices used by study participants included power wheelchairs, manual wheelchairs, scooters, and canes/crutches/walkers. The outcome measures used were the PIADS, QUEST, and CATTS. All three measures demonstrated acceptable reliability (internal consistency). Many consumers reported that they do not know if their supplier provides several important services. Mobility device users differ in their adjustment, satisfaction and knowledge of services available. These findings can provide direction to improving device selection and use.
KEY WORDS:
Mobility Device, Assistive Technology, Outcomes
BACKGROUND
Traditional measures of treatment effectiveness for interventions designed to improve the lives of people who use mobility devices have focused on personal care activities without considering the influence of assistive technology. Clinical assessments and subjective checklists to record changes in ability to perform functional tasks are conducted in clinical settings where environmental barriers are minimized. The gold standard for scoring the performance of people with mobility limitations has been the performance level of unimpaired, normal humans. For example, the Index of Activities of Daily Living (ADL) measurement of physical disability [(1)] was developed to assess performance on simple activities (e.g. bathing, dressing, toileting, transferring from bed to chair, feeding and getting around inside the home) but does not include the use of AT by individual with mobility impairments. The measured used in many rehabilitation facilities to assesses the level of independence in self-care, sphincter control, transfers, locomotion, communication and social cognition, the FIM (Functional Independence Measure), reduces independence scores if AT is used [(2)]. This measure is used in rehabilitation settings to evaluate patient progress in that setting and to predict the outcome of care [(3), (4)]. Steinfeld and Danford [(5)] have incorporated measures of the environment into the assessment of function the specific setting of the residence. The premise is that the person-environment fit depends on the person's abilities to master difficult environments and the demands of the environment. While this approach is a step in the direction of assessing the influence of environmental differences in human performance, the environmental setting is limited, the measure of function remains limited to a narrow range of simple activities and the use of different types of mobility devices has not been incorporated into the model.
Studies of mobility device users have focused on physical functioning including: speed, endurance, gait, heart rate, muscle contraction and fatigue without regard to how user perceive their mobility devices [(6), (7), (8), (9), (10), (11), (12), (13), (14)]. In addition, a number of studies have reported differences in consumer response to different types of walkers (i.e. 2 wheeled vs. 3 wheeled), crutches (i.e. axillary vs. forearm), or weights of manual wheelchairs (i.e. lightweight vs. standard) [(6), (7), (8), (9), (10), (11), (13), (15)] are made in clinics and focus on features of the mobility device.
We were unable to find studies of self-reports by different mobility device users that include both their psychological response to device use and their knowledge of and satisfaction with their mobility device. The purpose of this study was to compare the psychosocial impact, satisfaction with AT, and knowledge of AT services among four types of mobility devices users (power wheelchair, manual wheelchair, scooter, cane/crutch/walker).
METHODS
Participants:
The participants consisted of 130 adults between the ages of 18 and 80 who had a mobility impairment requiring the use of ambulatory aids (cane(s), crutch (es), walker, manual wheelchair, power wheelchair or scooter). All lived in the community and were discharged from rehabilitation at least one year at the time of the study. For the demographic characteristics of the samples see Table 1. In regards to income level, power wheelchair users had the highest percentage (42.4%) making less than $10,000/year, but also the highest percentage (12.1%) making over $75,000. Analysis of education levels indicate that scooter users had the highest percentage (40.7%) who attended four or more years of college while power wheelchair users had the highest percentage of never having attended school or only kindergarten with (2.9%).
| Total Population | Percentages per Group | |||||
|---|---|---|---|---|---|---|
| N=130 | PW (N=35) | MW (N=31) | SC (N=27) | CCW (N=37) | ||
Mobility Device |
26.9 | 23.8 | 20.8 | 28.5 | ||
Mean age |
49.6 | 46.7 | 47.9 | 48.8 | 55.3 | |
Gender |
||||||
Male |
40.8 | 40 | 61.3 | 22.2 | 35.1 | |
Female |
59.2 | 60 | 38.7 | 77.8 | 64.9 | |
Race |
||||||
White |
63.6 | 68.6 | 64.5 | 59.3 | 61.1 | |
Black/African American |
25.6 | 20 | 25.8 | 29.6 | 27.8 | |
Asian/Pacific Islander |
4.7 | 2.9 | 6.5 | 7.4 | 2.8 | |
American Indian/Alaskan Native |
1.6 | 2.9 | 0 | 0 | 2.8 | |
Other |
4.7 | 5.7 | 3.2 | 3.7 | 5.6 | |
Hispanic/Latino
Origin |
||||||
Yes |
3.8 | 5.7 | 0 | 0 | 8.1 | |
No |
95.4 | 91.4 | 100 | 100 | 91.9 | |
Marital
Status (May have chosen more than one option) |
||||||
Married |
33.1 | 34.3 | 22.6 | 29.6 | 43.2 | |
Divorced/Widowed/Separated |
26.9 | 25.8 | 29.1 | 18.5 | 32.4 | |
Never Married |
37.7 | 34.3 | 45.2 | 48.1 | 24.3 | |
Member of Unmarried Couple |
2.3 | 2.9 | 3.2 | 3.7 | 0 | |
Annual Income |
||||||
Less than $10,000 |
33.3 | 42.4 | 30 | 33.3 | 30.6 | |
$10,000 to less than $25,000 |
22.8 | 21.2 | 26.7 | 8.3 | 27.8 | |
$25,000 to less than $50,000 |
23.6 | 12.1 | 23.3 | 29.2 | 30.6 | |
$50,000 to $75,000 |
12.2 | 12.1 | 10 | 20.8 | 8.3 | |
Over $75,000 |
8.1 | 12.1 | 10 | 8.3 | 2.8 | |
Highest
Level Education |
||||||
Never attended or |
0.8 | 2.9 | 0 | 0 | 0 | |
only Kindergarten |
||||||
Grade 1-11 |
8.5 | 8.8 | 9.7 | 11.1 | 5.4 | |
Grade 12 or GED |
20.9 | 11.8 | 22.6 | 29.6 | 21.6 | |
College 1-3 years |
35.7 | 38.2 | 29 | 18.5 | 51.4 | |
College 4 or more years |
34.1 | 38.2 | 38.7 | 40.7 | 21.6 | |
| Note: PW = Power Wheelchair; MW = Manual Wheelchair; SC = Scooter; CCW = Cane/Crutches/Walker | ||||||
Assessments:
PIADS |
N | Alpha |
|---|---|---|
Overall |
||
Adaptability Overall |
130 | 0.85 |
Power |
34 | 0.79 |
Manual |
32 | 0.85 |
Scooter |
27 | 0.82 |
CCW |
37 | 0.87 |
Competency Overall |
128 | 0.89 |
Power |
33 | 0.83 |
Manual |
32 | 0.93 |
Scooter |
27 | 0.85 |
CCW |
36 | 0.82 |
Self-Esteem Overall |
130 | 0.84 |
Power |
34 | 0.74 |
Manual |
32 | 0.87 |
Scooter |
27 | 0.79 |
CCW |
37 | 0.8 |
QUEST |
||
Overall |
122 | 0.84 |
Power |
34 | 0.75 |
Manual |
29 | 0.83 |
Scooter |
25 | 0.87 |
CCW |
34 | 0.87 |
CATTS |
||
Overall |
130 | 0.8 |
Power |
34 | 0.79 |
Manual |
32 | 0.75 |
Scooter |
27 | 0.75 |
CCW |
37 | 0.83 |
Characteristics of Assistive Technologies and Technology Services (CATTS) was used to assess the mobility device user's knowledge of AT device/services/vendors; Quebec User of Evaluation of Satisfaction with assistive Technology (QUEST), was used to assess the mobility device user's satisfaction with AT device and services; The Psychosocial Impact of Assistive Devices Scale (PIADS ) was used to assess the mobility device user's perception of the influence AT use on their life. Both the PIADS and QUEST have undergone extensive reliability and validity testing to support their use [(16), 17), (18), (19), (20), (21), (22), (23), (24), (25)]. The CATTS is a new device that has good internal consistency (see Table 2).
Procedures:
The Washington University human subjects committee approved all procedures.
After obtaining informed consent, study participants were mailed a portion of the survey and asked to return them prior to visiting a community-based facility (Enabling Mobility Center, EMC). At the EMC they completed the assessment battery that included the PIADS, QUEST and CATTS. The participants repeated this procedure approximately 4-6 weeks later. Each interview lasted from 1.5 to 3 hours.
Analysis:
The internal consistency data was calculated for the first administration of the assessment battery. The data was analyzed using descriptive statistics. Trends in the data were identified and reported for device compatibility, physical fit, training, satisfaction with device features, and psychosocial factors.
RESULTS
Reliability of Measures (Internal Consistency)
All three measures (PIADS, QUEST and CATTS) showed moderate to high internal consistency. The PIADS found power wheelchair users have the lowest internal consistency for adaptability and self-esteem. The QUEST results show that power wheelchair users have the lowest internal consistency, while the CATTS showed the highest internal consistency among those using canes, crutch(es) or walkers (see Table 2).
Device Group Differences: Psychological Response to AT (PIADS)
 |
|---|
Three components of the PIADS are adaptability, competence and self-esteem. Both power wheelchair and scooter users reported significantly higher adaptability, competency and self-esteem than the manual wheelchair users (Figure 1). For rating competency in using their primary mobility devices, power wheelchair and scooter users rated their competency significantly higher than manual wheelchair users and those using canes, crutches or walkers. The level of self-esteem associated with primary mobility device was found to be higher for power wheelchair users than manual wheelchair users and the group using canes, crutches or walkers as mobility aids (see Figure 1).
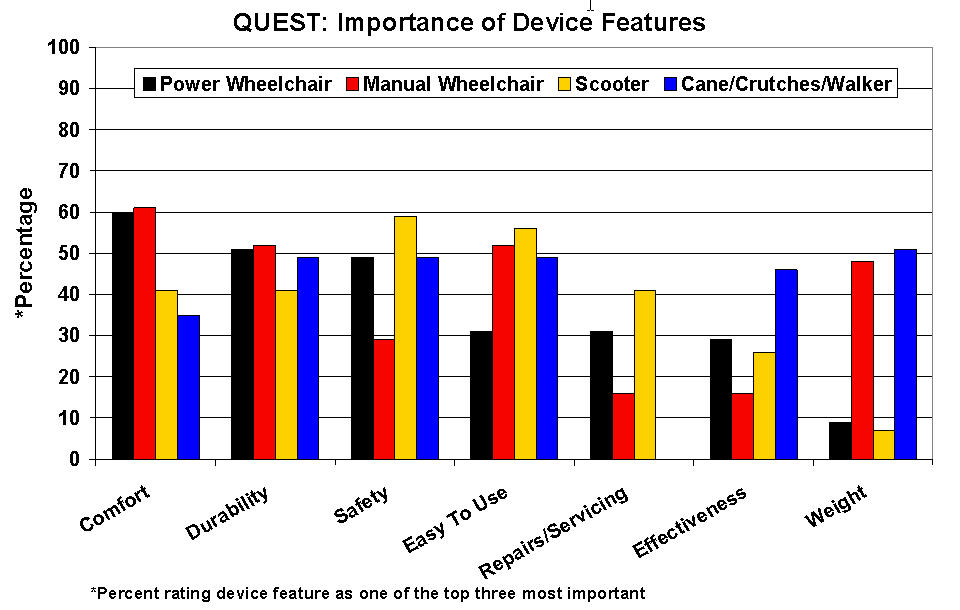
Device Group Differences: Importance of Device Features (QUEST)
 |
|---|
The QUEST is a measure of satisfaction with device features and service provision. When study participants were asked to give the three most important device features, several group differences emerged: 1) 60% of the power wheelchair and manual wheelchair users rated comfort as one of their top concerns: 2) Safety was less often reported as highly important to manual wheelchair users; 3) Power wheelchair and scooter users rated the importance of repairs and servicing higher than did manual and cane, crutches and walker users; 4) people who use cane, crutches and walkers rated effectiveness as more important than manual wheelchair users; and 5) as expected, power wheelchair and scooter users rated the weight of their devices as more important than did manual wheelchair users and cane, crutches and walker users (Figure 2).
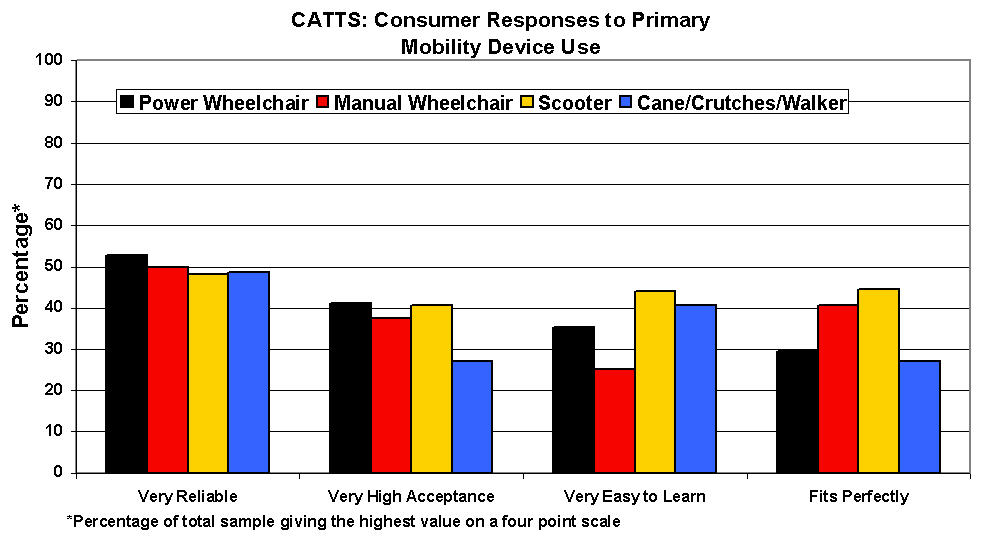
Device Group Differences: Device Use & Satisfaction/Knowledge of Service (CATTS)
 |
|---|
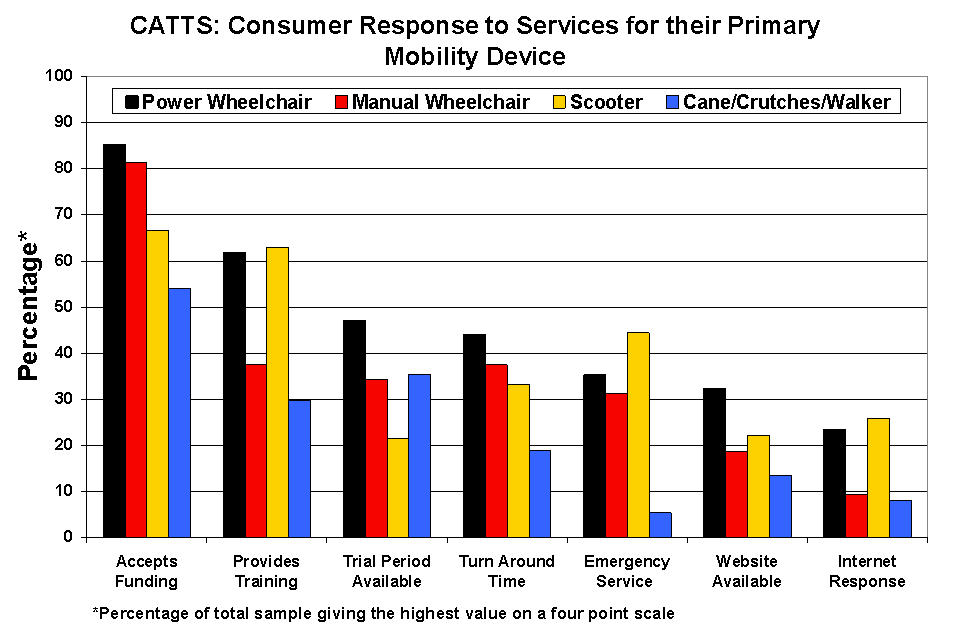
The questions used in the CATTS are directed at the quality of devices and the types of services provided by the facility that sold the equipment, usually a durable medical supply store. When asked to rate their primary mobility devices for a variety of features and services, the top ratings were given to level of device reliability, acceptance, ease of learning, and fit (Figure 3). Consumers are generally satisfied with funding efforts made by the supplier but provision of training, trial periods, turn around times and emergency services received fewer positive evaluations (Figure 4).
 |
|---|
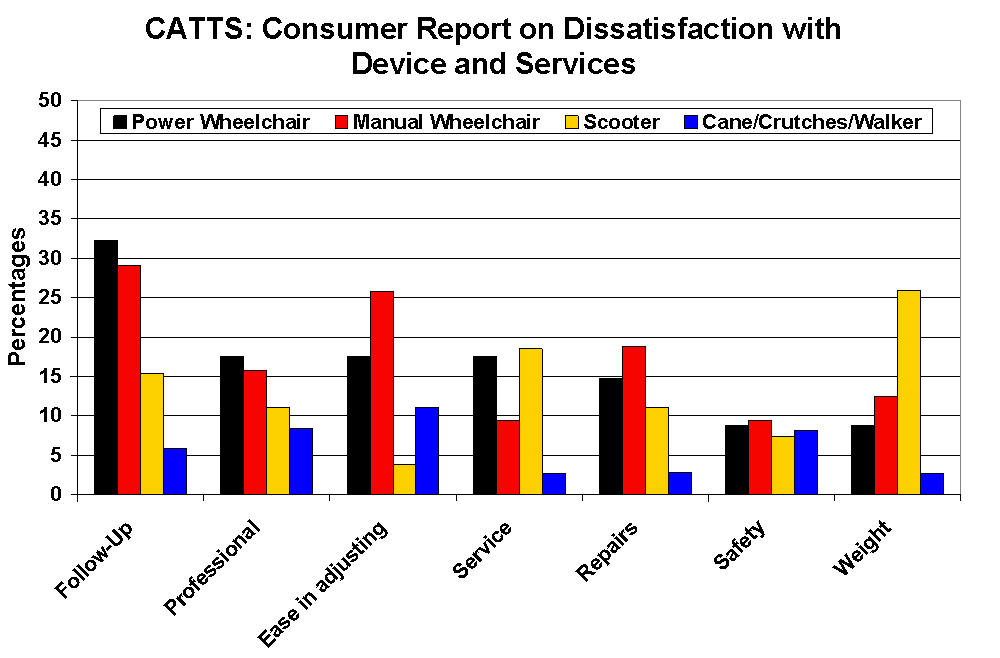
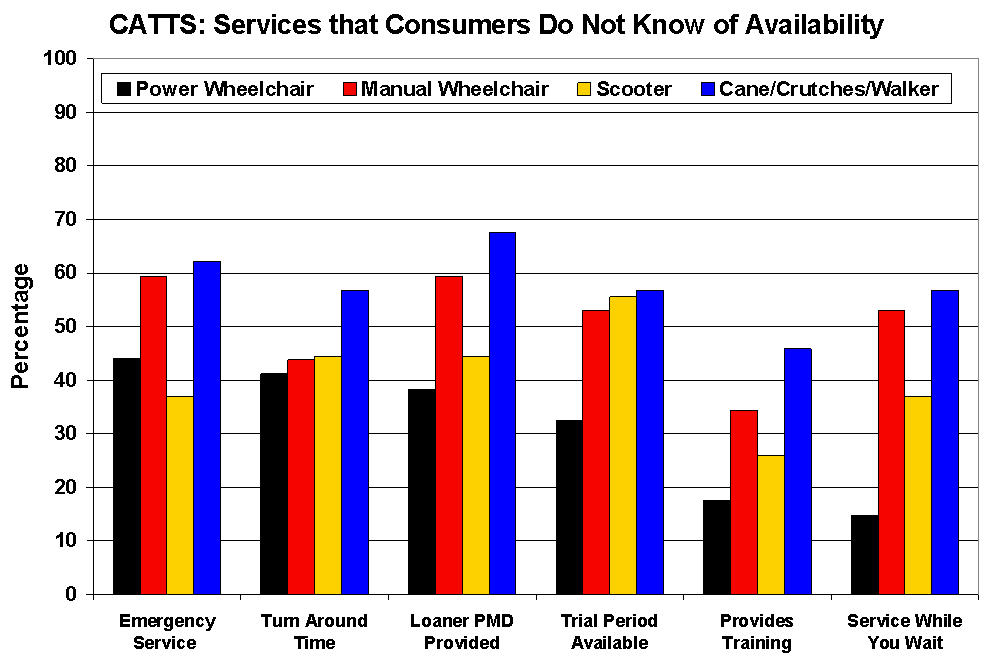
Users of canes, crutches or walkers are the least dissatisfied with services while power wheelchair users are the most dissatisfied (see Figure 5). In general, wheelchair users are more dissatisfied with their devices and services than scooter users. Many consumers reported that they did not know if several important services are proved by their supplier including: emergency services, turn around times, provision of loaners, trial periods, training or service while they wait (Figure 6).
 |
|---|
Power wheelchair users are more aware of the availability of loaners, trial periods, and training and while you wait services than are users of other mobility devices. Even so, the general lack of knowledge of what services might be available is an important finding for manufactures, suppliers and policy makers, who may address these needs in different ways. A comparison of the different groups on the evaluation of AT sales and dealership showed that only power wheelchair users were significantly more positive than users of canes/crutches/walkers.
DISCUSSION
 |
|---|
All three measures used in this study have demonstrated acceptable reliability (internal consistency). Power wheelchair and scooter users responded that their adaptability, competency and self-esteem were enhanced by the use of their devices, much more than did manual wheelchair and canes/crutches/walker users. Comfort and durability were rated by over 50% of wheelchair users as highly important device features. Safety was reported as important by fewer than 30% of manual wheelchair users while approximately 50% of the other mobility device groups report safety as important. The reliability, acceptance, ease of use and device fit are reported as very good by less than 50% of device users indicating that more work needs to be both to improve these aspects of device person interfacing. Dissatisfaction with service and device features is surprisingly low except for follow-up services for wheelchair users and device weight for scooter users. Many users report that they do not know if their device supplier provides emergency services, what the repair turner around times are, if repair services are available while they wait or is loaners are available. Taken together these results indicate that more attention needs to be paid to help consumers adjust emotionally to their mobility devices, to improve their satisfaction with their device by better understanding alternatives to their existing device, to advocate for a better fit of their bodies and their devices for comfort and ease of use, and to understand the services they need to request from mobility device suppliers and can get to keep their devices in good repair. The differences both within and between the groups of mobility device users points out the need to attend to the individual needs of each consumer.
REFERENCES
- Katz, M.M. & Lyerly, S.B. (1963). Methods for measuring adjustment and social behavior in the community: In rationale, description, discriminative validity and scale development. Psychological Reports, 3 , 503-535.
- Granger, Cotter, Hamilton & Fiedler (1993). Functional assessment scales: a study of persons after stroke. Archives of Physical Medicine and Rehabilitation, 74 :133-8.
- Granger & Brownscheilde (1995). Outcome measurement in Medical Rehabilitation. International Journal of Technology Assessment in Health Care 11 :262-8.
- Stineman, Jette, Fiedler, & Granger (1997). Impairment-specific dimensions within the Functional Independence Measure. Archives of Physical Medicine and Rehabilitation,78 (6): 636-643.
- Steinfeld & Danford (1997). Measuring Enabling Environments: Measuring the Impact of Environment on Disability and Rehabilitation. Kluwer Academic/Plenum Publishers.
- Chiou-Tan, F. Y., Magee, K.N., & Krouskop, T.A. (1999). Comparison of upper limb muscle activity in four walking canes: A preliminary study. Journal of Rehabilitation Research and Development , 36 (2).
- Fitzgerald, S.G., Cooper, R. A., Boninger, M.L., & Rentschler, A.J. (2001). Comparison of fatigue life for 3 types of manual wheelchairs. Archives of Physical Medicine and Rehabilitation, 82, 1484-1488.
- Greiner, B.M., Czerniecki, J.M., and Deitz, J.C. (1993). Gait Parameters of children with spastic diplegia: A comparison of effects of posterior and anterior walkers. Archives of Physical Rehabilitation, 74 , 381-385.
- Hall, J., Elvins, D.M., Burke, S.J., Ring E.F.J., & Clarke, A. K. (1991). Heart rate evaluation of axillary and elbow crutches. Journal of Medical Engineering & Technology, 15, 232-238.
- Mahoney, J. Euhardy, R., & Carnes, M. (1992). A comparison of a two-wheeled walker and a three-wheeled walker in a geriatric population. Journal of American Geriatrics Society, 40 , 208-212.
- Park, E.S., Park, C. I., & Kim, J.Y. (2001). Comparison of anterior and posterior walkers with respect to gait parameters and energy expenditure of children with spastic diplegic cerebral palsy. Yonsei Medical Journal, 42 (2), 180-184.
- Tang, S. F. T., Tuel, S.M., McKay, B., & Dimitrijevic, M. (1994). Correlation of motor control in the supine position and assistive device used for ambulation in chronic incomplete spinal cord-injured persons. American Journal of Physical Medicine & Rehabilitation, 73 (4), 268-274.
- 13. Tsai, H. A., Kirby, R.L., MacLeod, D.A., & Graham, M. (2003). Aided gait of people with lower-limb amputations: Comparison of 4-footed and 2-wheeled walkers. Archives of Physical Medicine and Rehabilitation, 84 , 584-591.
- Waters, R.L., Yakura, J.S., Adkins, R., & Barnes, G. (1989). Determinants of gait performance following spinal cord injury. Archives of Physical Medicine and Rehabilitation, 70 , 811-818.
- Rogers, H., Berman, S., Fails, D., & Jaser, J. (2003). A comparison of functional mobility in standard vs. ultralight wheelchairs as measured by performance on a community obstacle course. Disability and Rehabilitation, 25 (19), 1083-1088.
- Day, H., & Jutai, J. (1996). Measuring the psychosocial impact of assistive device: the PIADS. Canadian Journal of Rehabilitation, 6 (2), 159-168.
- Day, H., Jutai, J. & Campbell K.A. (2002). Development of a scale to measure the psychosocial impact of assistive devices: lessons learned and the road ahead. Disability and Rehabilitation, 24 (1), 34-37.
- Day, H., Jutai, J., Woolrich, W., & Strong, G. (2001). The stability of impact of assistive devices. Disability and Rehabilitation, 23 (9), 400-404.
- Demers, L., Monette, M., Lapierre, Y., Arnold, L. & Wolfson, C. (2002). Reliability, validity, and applicability of the Quebec User Evaluation of Satisfaction with Assistive Technology (QUEST 2.0) for adults with multiple sclerosis. (2002). Disability and Rehabilitation, 24 (1-3), 21-30.
- Demers, L., Weiss-Lambrou, R., Ska, B. (2000). Item Analysis of the Quebec User Evaluation of Satisfaction with Assistive Technology (QUEST). Assistive Technology, 12 (2), 96-105.
- Gryfe, P., & Jutai, J. (1998). Assistive Technologies: Clients' perceptions of impact on quality of life. Rehab & Community Care Management. Fall , 26-30.
- Jutai, J. (1999). Quality of life impact of assistive technology. Rehabilitation Engineering, 14 (1), 2-6.
- Jutai, J. (2001). Measuring the psychosocial impact of assistive technology. In Proceedings of the 16 th Annual International Conference on Technology and Persons with Disabilities , Los Angeles, California.
- Jutai, J. & Gryfe, P. (1998). Impacts of assistive technology on clients with ALS. RESNA, June, 54-56.
- Wessels, R.D. & DeWitte, L.P. (2003). Reliability and validity of the Dutch version of the QUEST 2.0 with users of various types of assistive devices. Disability and Rehabilitation, 25 (6), 267-272.
ACKNOWLEDGEMENTS
This study was funded by the National Institute on Disability and Rehabilitation Research
Author Contact Information:
David B. Gray, Ph.D.,
Washington University School of Medicine,
Program in
Occupational Therapy
4444 Forest Park Blvd., Campus Box 8505,
St. Louis, MO
63108,
voice: (314) 286-1658,
email:grayda@wustl.edu