Upper Extremity Biomechanical Model for Quantitative Assessment of Stroke Rehabilitation
ABSTRACT
A three-dimensional (3D) biomechanical model of the upper extremity was developed for quantification of stroke rehabilitation. Current studies of stroke rehabilitation lack quantitative assessment or do so inaccurately. The new model will accurately track the 3D orientation of the trunk, shoulder, elbow and wrist. This study explains the development, validation, and application of the upper extremity model. Analysis of the model shows that it is accurate and reliable in capturing upper extremity motion. This model may aid in the assessment and planning of stroke rehabilitation, and help to decrease recovery time. Both simple and complex biomechanical indices for assessment are provided.
KEYWORDS
Kinematics, motion analysis, stroke, rehabilitation, upper extremity
BACKGROUND
Each year about 750,000 Americans suffer a stroke, two thirds of which are left with residual neurological deficits that persistently impair function (1-3). Recovery and rehabilitation is largely related to the location and severity of the lesion. Successful rehabilitation involves relearning skills, recovery of ischemically injured cells, and brain plasticity. Appropriate treatments may be effective in uncovering latent movement patterns to maximize recovery (4). In current studies, Botulinum Toxin Type A (BTX-A) is employed in an attempt to provide a more timely and effective rehabilitation course following stroke. Established motor impairment scales, such as the Fugl-Meyer, may be insensitive to small changes in impairment and are not designed to measure functional use (5). Several studies have examined reaching tasks in stroke subjects, but very few quantify upper extremity motion (6). The existing models lack three-dimensional (3D) Euler rotation calculations (4,7) necessary for accurate quantification . Existing models also lack intuitive, yet clinically applicable indices of performance. Data resulting from current models is often collected with small sample populations (8).
Quantitative methods are necessary for more accurate evaluation of stroke rehabilitation. The results of this work may aid in the assessment and planning of stroke rehabilitation. In this study, a 3D kinematic model was developed to detect changes in upper extremity joint orientation during stroke rehabilitation. The current BTX-A project seeks to reduce stroke recovery time and increase resulting function.
RESEARCH QUESTION
The subject of this work is the design and validation of an upper extremity (UE) motion assessment system to track progress during stroke recovery. The goal of this study is to determine if a unique biomechanical model can assess changes in functional motor control. A clinical objective of this study is the development of a useful clinical index of performance.
METHODOLOGY
 |
|---|
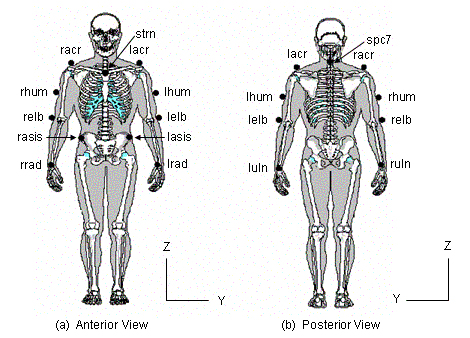
The UE motion model is composed of 5 segments: 1) trunk, 2) left upper arm, 3) left lower arm, 4) right upper arm and 5) right lower arm. Fourteen markers are placed on bony landmarks to define segments (Figure 1). Four three-degree of freedom joints connect the rigid segments at the elbow and shoulder joints.
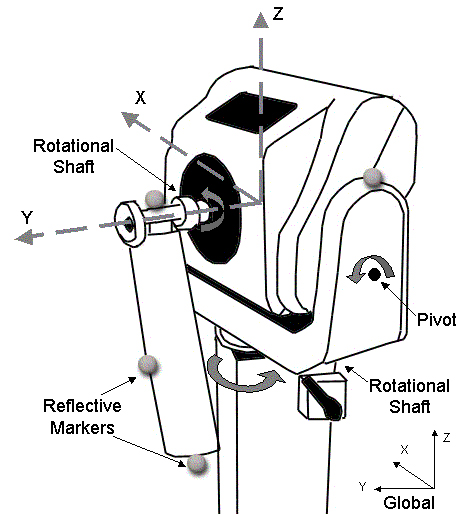
Euler rotations, sequenced Y-Z-X, express the joint angles (distal with respect to proximal), utilizing each segment's local coordinate system. The trunk segment was described relative to the lab coordinate system. A 15-camera Vicon 524 system (Vicon Motion Systems, Inc., Lake Forest, CA) captured the UE motion patterns at 120 Hz. Resolution and accuracy of the model was examined statically and dynamically. Static testing used 4 markers placed on a fixed segment (to represent intermarker distances) oriented along the X, Y and Z-axes as marker data was captured. Dynamic angular testing was completed using a Biodex System-3 (Biodex Medical Systems, Inc., Shirley, NY) through ranging fixed speeds of 20, 150 and 300 degrees/sec. A 3-marker segment was attached to the Biodex arm while 4 markers were placed on the stationary chassis, as shown in Figure 2. The Biodex was oriented along the X, Y and Z-axes for comparison of angular output from the Biodex system to the motion analysis system.
 |
|---|
Following validation, the UE model was applied to 8 subjects diagnosed with spastic hemiparesis, secondary to a stroke. Assessment included biomechanical and clinical evaluation. Clinical measures of the Ashworth scale, Fugl-Meyer scale and Functional Hand Test were completed. Assessment occurred one week before receiving the BTX-A injection, on the day of injection, and 30 days following injection. The biomechanical protocol included 3 tasks while subjects were seated at a table: 1) reach an anterior target, 2) fast reach, and 3) pronation/supination. Muscle activity was recorded during all tests with a 16 channel surface EMG system (Motion Lab Systems, Inc., Baton Rouge, LA).
RESULTS
Static resolution was highest in the sagittal plane with an average value of 0.17 ± 0.26 mm (p = 0.05), shown in Table 1. The greatest average accuracy of 99.99% was in the coronal plane. Dynamic resolution and accuracy were 0.61 ± 0.30 mm and 99.91% respectively.
Orientation |
Marker Distance (mm) |
Resolution (mm) |
Accuracy (%) |
|---|---|---|---|
X-axis |
50 |
0.40 ± 0.23 |
100.0 |
150 |
0.20 ± 0.23 |
100.0 |
|
300 |
0.02 ± 0.27 |
99.97 |
|
Y-axis |
50 |
0.25 ± 0.28 |
99.90 |
150 |
0.02 ± 0.27 |
99.99 |
|
300 |
0.27 ± 0.28 |
99.98 |
|
Z-axis |
50 |
0.37 ± 0.39 |
99.34 |
150 |
0.92 ± 0.99 |
99.22 |
|
300 |
1.43 ± 1.21 |
99.51 |
Validation results of linear dynamic resolution and accuracy are shown in Table 2 (9). Angular dynamic validation, displayed in Table 3, demonstrated a mean resolution of 0.84 ± 0.80 degrees and mean accuracy of 99.59% in the three clinical planes (10).
Marker Distance (mm) |
Resolution (mm) |
Accuracy (%) |
|---|---|---|
50 |
0.08 ± 0.32 |
99.77 |
150 |
0.65 ± 0.28 |
99.97 |
300 |
1.10 ± 0.31 |
99.97 |
Orientation |
Resolution (degrees) |
Accuracy (%) |
|---|---|---|
X-axis |
0.86 ± 0.34 |
99.69 |
Y-axis |
0.89 ± 0.84 |
99.57 |
Z-axis |
0.78 ± 1.23 |
99.51 |
 |
|---|
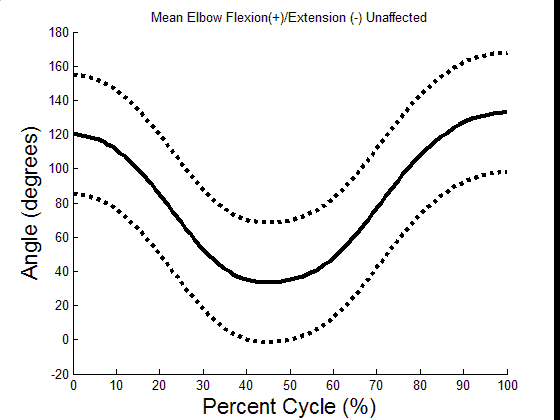
Mean elbow extension for the unaffected and affected arms of the entire population during reaching is presented in Graph 1 and Graph 2, respectively.
DISCUSSION
Static and dynamic test results confirm system accuracy and reliability in capturing 3-D UE motion. Validation results were greatest in the coronal and transverse planes. The model appears to be effective in detecting changes in upper extremity joint motion.
 |
|---|
The system was highly sensitive to changes in range of elbow motion, thus the affected graph showed three main groups based on functionality. The first group remained in a relatively constant state of flexion. The second group displayed a small range of flexion and extension. The third group remained in a position closer to extension with little range of motion. The model displayed dynamic capability for quantifying reaching tasks. Useful clinical indices of performance appear to be related to elbow range of motion, joint excursion and temporal parameters. Knowledge gained from this study may help design a more effective and streamlined protocol to evaluate UE rehabilitation. Further testing is underway with a larger clinical population to quantify changes from pre to post Botox treatment.
REFERENCES
- Gresham, G.E., and Dawber T.R. (1975). Residual disability in survivors of stroke: the Framingham Study. N. Engl. J. Med., 293(19):954-956.
- Williams, G.R., Jiang, J.G., Matchar, D.B., and Samsa, G.P. (1999). Incindence and occurrence of total (first-ever and recurrent) stroke. Stroke, 30(12):2523-2528.
- Macko, R.F., Haeuber, E., Shaughnessy, M., Coleman, K.L., Boone, D.A., Smith, G.V., and Silver, K.H.(2002). Microrocessor-based ambulatory activity monitoring in stroke patients. Med. Sci. Sports Exerc., 34 (3): 394-399.
- Michaelsen, S.M., Lutda, A., Roby-Brami, A., and Levin, M.F. (2001). Effect of trunk restraint on the recovery of reaching movements in hemiparetic patients. Stroke, 32(8): 1875-83.
- Stein J. (2003). Wearable sensor technology for functional assessment after stroke. IEEE Eng Med Biol Mag. 22(3): 26-7.
- Kamper, D.G., McKenna-Cole, A.N., Kahn, L.E., and Reinkensmeyer, D.J. (2002). Alterations in reaching after stroke and their relation to movement direction and impairment severity. Arch. Phys. Med. Rehabil., 83: 702-707.
- Adamovich, S.V., Archambault, P.S., Ghafouri, M., Levin, M.F., Poizner, H. and Feldman, A.G. (2001). Hand trajectory invariance in reaching movements involving the trunk. Exp. Brain Res., 138(3): 288-303.
- Yang, N., Zhang, M., Huang, C., and Jin, D. (2002). Synergic analysis of upper limb target-reaching movements. J. Biomech., 35(6): 739-746.
- Hingtgen, B.A., McGuire, J.R., Wang, M., and Harris, G.F. (2003). Design and Validation of an Upper Extremity Kinematic Model for Application in Stroke Rehabilitation. Proc. IEEE/EMBS 25: 200.
- Myers, K.A. (2001). Validation of a multi-segment foot and ankle kinematic model for pediatric gait, M.S. Thesis, Biomed. Eng. Program, Marquette Univ., Milwaukee, WI.
ACKNOWLEDGMENTS
This work was funded by Allergan, Inc. ( Irvine, CA) and The Orthopaedic and Rehabilitation Engineering Center, OREC (Milwaukee, WI) .
Author Contact Information:
Brooke Hingtgen, BS,
Marquette University,
9200 W. Wisconsin Ave.,
Milwaukee,
WI, 53226
Office Phone (414) 805-7456
EMAIL: brooke.hingtgen@marquette.edu