Characteristics of Wheelchair Users and Associated Motor Vehicle Transportation Usage
ABSTRACT
Wheelchair transportation safety is a major concern, however little is known about the characteristics of wheelchair users who utilize transportation. This study is designed to examine and compare the transportation use of individuals using either power or manual wheelchairs. A survey completed by 282 wheelchair users was conducted to identify this information. The results showed little differences between the power wheelchair and manual wheelchair user regarding their transportation use, with private vehicles (driver/passenger) being the most frequently used form of transportation. These finding suggest that the private vehicle transportation domain may be a very important area of focus for future research and policy design initiatives.
KEYWORDS
Wheelchair type, transportation
BACKGROUND
The number of social and economic opportunities available to persons with disabilities has increased with the implementation of the Americans with Disabilities Act (ADA). This piece of legislation has increased the participation in employment, recreation and other activities by wheelchair users, thus increasing the needs and opportunities in the area of motor vehicle transportation. Many wheelchair users are unable to transfer to the vehicle seat while in transportation, thus requiring the wheelchair to serve as the vehicle seat. Safety concerns are raised in this situation, because wheelchair-seated travelers are not able to benefit from the safety features that are integrated into the vehicle. (1,2)
Standards, such as the SAE (Wheelchair Tiedowns and Occupant Restraints) and ANSI/RESNA WC19 (Wheelchairs Used as Seats in Motor Vehicles), regarding the wheelchair design and securement have been created and implemented, in order to reduce the risk of injury to wheelchair-seated-riders. (3,4) However, important safety questions still remain regarding individuals who ride while seated in their wheelchair. For example, it is not yet known how various types of wheelchair riders utilize transportation, and if current initiatives meet their needs.
RESEARCH QUESTION
The goal of this research project is to identify the type of wheelchair (power/manual) used, and associated motor vehicle transportation usage patterns, in regard to the vehicle mode, frequency of use and wheelchair securement during transportation. These data can provide descriptive information to supplement existing research, policy and standards, in addition to suggesting future areas of study for wheelchair transportation safety.
METHODS
The study consists of 282 wheelchair users who self-identified in a telephone screening survey, that they 1) use a wheelchair as their primary means of mobility and 2) at least some point in time remain in their wheelchair during transportation use. Once eligibility was determined, a 12 page survey, consisting of questions regarding design of wheelchair, seating position in vehicle, mode of transportation used and type of wheelchair securement, was mailed. Informed consent was provided by all subjects. Chi-square and t-test analysis was completed using SPSS statistical software.
RESULTS
As of November 2003, 282 wheelchair users completed and returned the survey. The data showed that the sample population consisted of 49.3% male, with a mean age of 43.6 ± (14.8) years. 72.2% of the subjects had a non-progressive disability (spinal cord injury, cerebral palsy, spina bifida), as compared to 27.8% with a progressive disability (multiple sclerosis, muscular dystrophy). 67.4% of the population reported using a power wheelchair, while 32.6% reported using a manual wheelchair as their primary means of mobility.
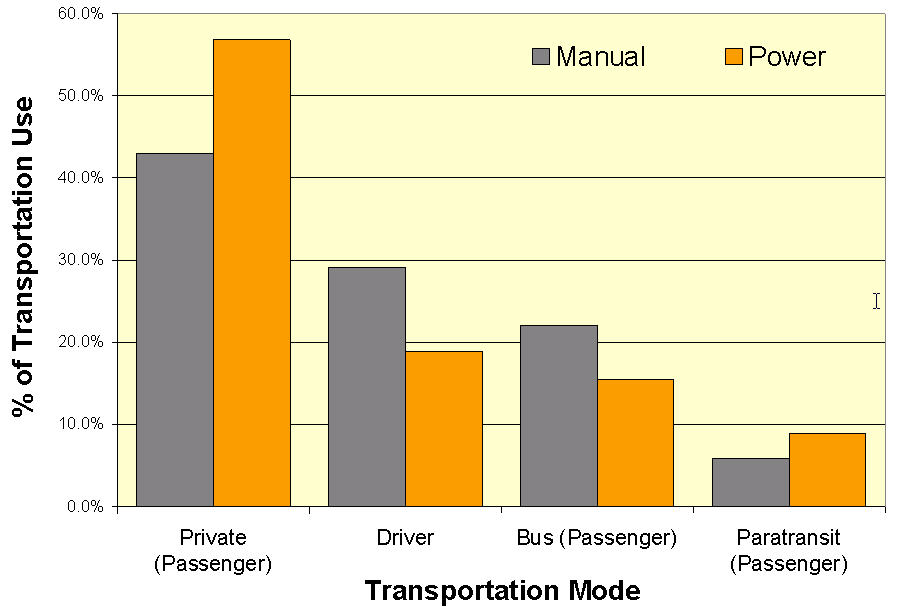
In regard to the primary transportation (distance traveled as defined by miles traveled in past week) of the surveyed individuals, motor vehicle usage patterns were found to be similar when comparing power and manual wheelchair users. Riding as a passenger in a private vehicle was the primary mode of transportation for both types of wheelchairs (manual: 43.0%; power: 56.8%), followed by driver of a private vehicle (manual: 29.1%; power: 18.9%), passenger in a paratransit vehicle (manual: 22.1%; power: 15.4%) and finally passenger in a mass transit bus (manual: 5.8%; power: 8.9%).
 |
|---|
Analysis of users of different wheelchair types showed that a significant difference between the user gender and the type of wheelchair used (p-value = .003) existed. Manual wheelchair users were more likely to be male (manual: 62.0%; power: 42.3%), and slightly younger than power wheelchair users (manual: 40.73 ± (15.50); power: 44.60 ± (14.30)). It was also shown that manual chair users (88.1%) are significantly more likely to have a non-progressive disability than power chair users (64.8%).
Analysis was also completed examining the type of wheelchair and the general use of motor vehicle transportation. The data showed that 32.6% of manual wheelchair users, and 26.8% of power wheelchair users reported driving a private vehicle. All drivers who drove from their wheelchair, used some form of wheelchair securement. In regard to wheelchair type, the number of individuals who ride as passengers in private vehicles is similar, (manual: 88.6%; power: 90.4%). However, power chair users are more likely to not use securement (18.4%), when compared to manual chair users (8.0%). 44.8% of manual wheelchair users reported using a mass transit bus for at least some of their transportation needs. Slightly more power wheelchair users use bus transportation (55.3%). In regard to wheelchair securement, more power chair users are likely to not use securement (23.5%) while traveling on a mass transit bus, than manual wheelchair users (11.8%). The number of manual and power wheelchair users using paratransit is similar (manual: 64.4%; power: 65.8%). Nearly all of these individuals utilize some form of wheelchair securement (manual: 96.2%; power: 97.5%).
|
Manual |
Power |
|---|---|---|
Gender (male) * |
62.0% |
43.2% |
Age (mean) |
40.73 |
44.6 |
Non-Progressive * |
88.1% |
64.8% |
|
|
|
Driver |
32.6% |
26.8% |
Remain in WC |
36.7% |
52.0% |
Use Securement |
100.0% |
100.0% |
|
|
|
Private (Passenger) |
88.6% |
90.4% |
Remain in WC * |
28.2% |
75.1% |
Use Securement |
92.0% |
81.6% |
|
|
|
Bus |
44.8% |
55.3% |
Remain in WC |
100.0% |
99.0% |
Use Securement |
88.2% |
76.5% |
|
|
|
Paratransit |
64.4% |
65.8% |
Remain in WC |
96.6% |
98.4% |
Use Securement |
96.2% |
97.5% |
| * p-value <0.05 | ||
Analysis of seating position was also completed. Of our sample that reported to remaining in the wheelchair while in transport, under certain circumstances, we found the following patterns: private vehicle-driver (manual: 36.7%; power: 52.0%), private vehicle-passenger (manual: 28.2%; power: 75.1%), mass transit bus (manual: 100%; power: 99%) and paratransit (manual: 96.6%; power: 98.4%).
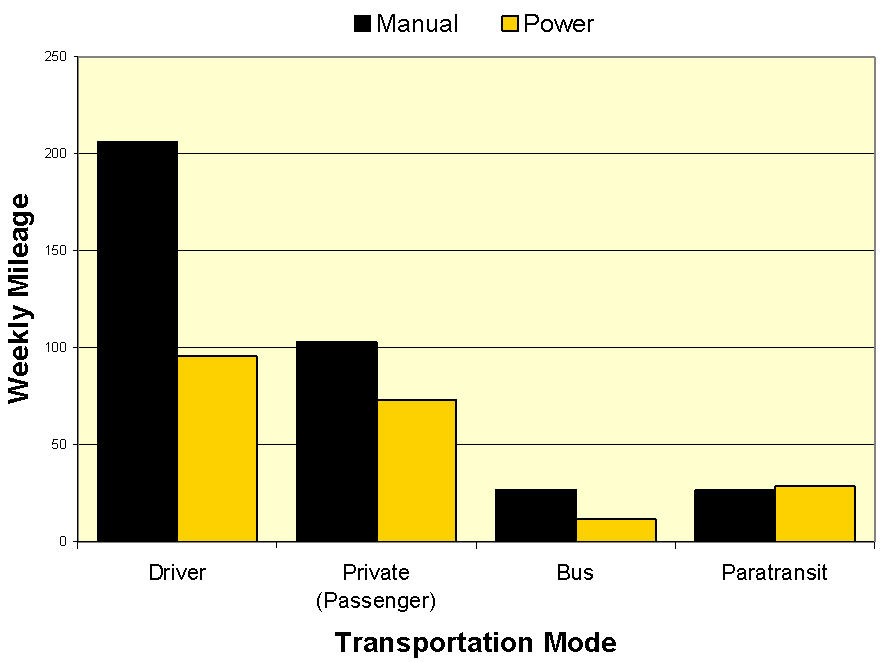
Next, we examined each mode of transportation use relative to the distance traveled in that type of vehicle, as individuals using transportation infrequently may differ markedly from those using it more often. Categories reflecting level of use were created for each mode of transportation based upon the reported exposure (mileage/week) for each vehicle type. Drivers were categorized as either, low, medium or high mileage drivers. No significant difference between manual and power wheelchair users was observed in this analysis. Passengers were categorized into four groupings based on mileage per week (0, 1-10, 11-50 or 51+ miles). The analysis of passengers in private vehicles showed that manual wheelchair users were significantly more likely to travel more than miles per week (72.7%), when compared to power wheelchair users (36.6%). When looking at public transportation (mass transit buses or paratransit), there was no significant difference in transportation exposure between manual and power wheelchair users. When examining the mean mileage per week for each mode of transportation, driving was the most frequent form of transportation used by both wheelchair types (manual: 206.1; power: 95.5 miles), followed by private vehicle passenger (manual: 103.0; power: 72.9 miles), mass transit bus (manual: 26.8; power: 11.4 miles) and paratransit vehicle (manual: 26.5; power: 28.5 miles).
 |
|---|
DISSCUSION
Understanding the transportation characteristics of wheelchair users with respect to the wheelchair type, seating position, transportation mode, frequency and wheelchair securement is essential for the design and implementation of new research and standards in the area of wheelchair transportation safety. This descriptive study found that manual and power wheelchair users, in many ways, use transportation the same. These findings showed that over 70%, regardless of wheelchair type, use private vehicles (driver or passenger) as their primary means of transportation.
A dissimilarity that was seen, shows that power wheelchair users (55%) are more likely to use bus transportation, when compared to manual wheelchair users (45%). In addition, power wheelchair users are more likely to travel as wheelchair-seated-riders as both drivers and private vehicle passengers.
Transportation exposure is higher for manual wheelchair users in all modes of transportation, with the exception of paratransit, which shows slightly higher usage by power wheelchair users
This study is representative of the experiences of a convenience sample of 282 wheelchair users, who identified to traveling at least some point as wheelchair-seated-riders, because of this inclusion criteria a bias may be present in the analysis and reporting of the seating position. Responses were received from subjects across the United States and reflect numerous disabilities. The responses from a random sample of wheelchair users may differ.
This analysis found little difference in transportation use between manual and power wheelchair users, but highlights that many wheelchair users utilize private transportation (driver and passenger), with much higher exposure rates in these vehicles. The results suggest that research addressing private vehicle transportation is needed, with both manual and power wheelchair users in mind.
REFERENCES
- Bertocci, G.E., Evans, J. (2000). Injury Risk Assessment of Wheelchair Occupant Restraint Systems in a Frontal Crash: A Case for Integrated Restraints. Journal of Rehabilitation Research and Development, 37(5).
- Rehabilitation Engineering Research Center on Wheelchair Transportation Safety (2002), SP-4: Investigate and Compare Methods of Crashworthiness of Wheelchair Seated Systems and Peripheral Devices. Retrieved November 15, 2002, from http://www.rercwts.pitt.eud/RERC_WTS_Res/RERC_WTS_RES_SP/RERC_WTS_res_sp4.html
- ANSI/RESNA: Wheelchairs Used as Seats in Motor Vehicles. (1999). Vol. 4(19).
- SAE: SAE J2249 - Wheelchair Tiedowns and Occupant Restraint Systems for Use in Motor Vehicles, 1996.
ACKNOWLEDGEMENTS
This study was funded by the National Institute on Disability and Rehabilitation Research (NIDRR) and the Rehabilitation Engineering Research Center (RERC) on Wheelchair Transportation, grant # H133E010302. The opinions expressed herein are those of the authors and are not necessarily reflected of NIDRR opinions.
K. Ashley Rotko,
Center for Injury Research and Control
Suite B-400 UPMC Presbyterian,
200 Lothrop
Street,
Pittsburgh, PA 15213
(412) 383-7047,
(412) 648-8924 (fax),
karst55@pitt.edu