Reducing Variability in Wheelchair Propulsion Outcomes
Abstract
When pushing a manual wheelchair there is a natural variability in the push forces applied by the user. There are inconsistencies among wheelchair propulsion researchers in the selection of the number of pushes to analyze. In this study, a single subject with seven years of wheelchair experience pushed in his own wheelchair on a treadmill for a total of 100 pushes. The peak resultant force, peak moment about the wheel, push angle, and push frequency were determined for each push. Variability in propulsion outcomes were recorded and compared using six different push groupings (3, 5, 10, 15, 20, and 30 pushes). Too few pushes analyzed resulted in a high coefficient of variation (CV). With an increase in the number of pushes analyzed (3 to 30) the CV of the peak force decreased by 60.9%. Based on the results of this study, it is recommended that at least 15 pushes be used, corresponding to a 3% CV in peak force in order to reduce the variability in wheelchair propulsion outcomes.
Keywords :
wheelchair, handrim, wheelchair propulsion, kinetics.
Background
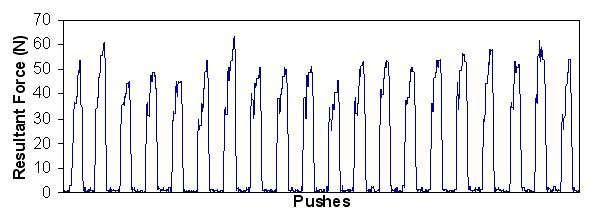
The biomechanics of manual wheelchair propulsion are not fully understood. As researchers have attempted to gain insight into the outcomes of wheelchair propulsion by analyzing handrim forces, they have discovered variability in the force profile from push to push (Figure 1).
 |
|---|
Propulsion analysis generally involves averaging outcomes from a number of pushes to create a single characteristic value. Past research has shown a range (3 to 15) in the number of pushes analyzed during manual wheelchair propulsion research [1,2,3]. The number of pushes analyzed affects the variability in these outcomes. This variability can lead to inconclusive or misleading results.
Research Question
How many pushes should be analyzed in order to reduce variability in propulsion outcomes?
Method
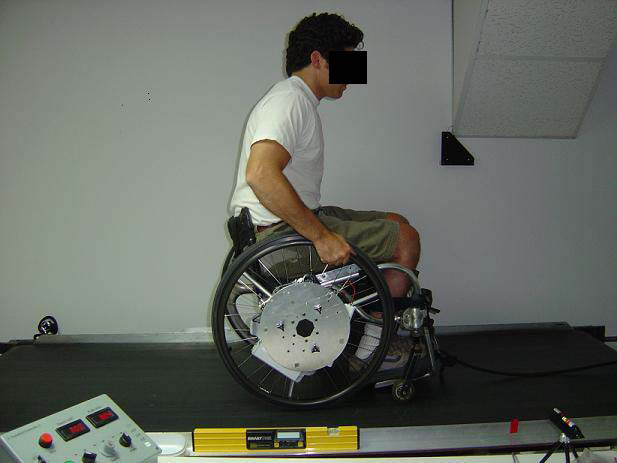
One male manual wheelchair user, 30 years of age, with a T12 spinal cord injury and seven years of wheelchair experience participated in the study. The subject's 24-inch rear wheels were removed and replaced with test wheels. The right test wheel was a propulsiometer (wireless instrumented 6DOF wheel) equipped with a commercially available load cell (ATI, Garner, NC), an absolute inclinometer (US Digital, Vancouver, WA), and a MiniDAT (ViaSat, Carlsbad, CA) for wireless capabilities (Figure 2). The subject was then asked to propel his own wheelchair on a treadmill set at a 2% grade at a velocity of 0.94 m/s (2.1 mph) for 100 pushes. The load cell voltage output was converted into handrim propulsion force and moment values using the manufacturer provided calibration matrix. Signal from the wheel sensors, via the MiniDAT, were sampled by a data acquisition system at 400 Hz (National Instruments, Austin, TX). The data was then smoothed using a Butterworth fourth order low-pass filter with a cut off frequency of 20 Hz.
 |
|---|
The propulsion results were analyzed and divided into individual pushes. Pushes were identified by non-zero forces applied to the handrim. Cycle time was calculated as the time between pushes. Four outcomes were determined for each push: 1) the peak force, 2) peak moment about the wheel axle, 3) push angle (arc of the hand during the push), and 4) push frequency (inverse of cycle time). The peak force for each push was defined as the maximum resultant force applied to the handrim during the push. The peak moment was determined similarly for each push.
Analyses of the propulsion outcomes were performed for six series of push groupings: 3, 5, 10, 15, 20, and 30. Analysis of each push grouping started with the first push and was repeated for every fifth push. Within each push grouping the individual outcomes were averaged. The push groupings were then analyzed for variability. The coefficients of variation (CV) (standard deviation divided by the mean) and maximum variations were calculated for each series as a measure of variability. Maximum variation was determined by taking the maximum value minus the minimum value divided by the mean value.
Results
 |
|---|
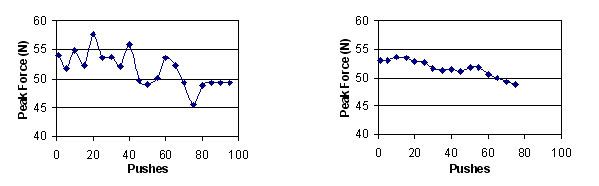
A graphical representation of the differences in variability of averaged peak forces between a 3-push analysis and a 20-push analysis are shown in Figure 3. The CV and the maximum variation were found to be inversely proportional to the number of pushes analyzed. The relative percent decrease in CV from 3 to 30 pushes for the four propulsion outcomes were: 1) 60.9% for peak force, 2) 59.0% for peak moment, 3) 71.8% for push angle, and 4) 40.2% for push frequency (Table 1). The push angle had the greatest relative percent decrease in the CV, while the push frequency had the least. The relative percent decrease in the maximum variations for the four propulsion outcomes were: 1) 68.4% for peak force, 2) 55.5% for peak moment, 3) 73.0% for push angle, and 4) 62.8% for push frequency (Table 2). The push angle had the greatest relative percent decrease in the maximum variation, while the peak moment was the least.
Pushes |
Peak F |
Peak MZ |
Push Angle |
Push Frequency |
|---|---|---|---|---|
3 |
23.538 |
14.767 |
10.002 |
21.992 |
5 |
16.424 |
16.068 |
8.614 |
15.753 |
10 |
11.196 |
12.129 |
5.708 |
12.105 |
15 |
10.046 |
8.847 |
4.580 |
10.539 |
20 |
9.364 |
7.743 |
3.059 |
9.341 |
30 |
7.438 |
6.597 |
2.657 |
8.155 |
Pushes |
Peak F |
Peak mz |
Push Angle |
Push Frequency |
|---|---|---|---|---|
3 |
5.746 |
4.238 |
3.344 |
5.221 |
5 |
4.370 |
3.884 |
2.535 |
4.279 |
10 |
3.468 |
3.046 |
1.846 |
3.948 |
15 |
2.999 |
2.450 |
1.269 |
3.782 |
20 |
2.803 |
2.231 |
0.917 |
3.593 |
30 |
2.227 |
1.700 |
0.865 |
3.143 |
Discussion
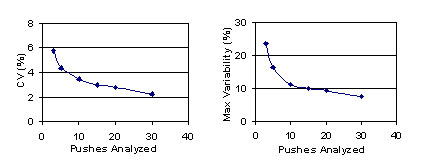
The effect of analyzing different numbers of pushes on variability in wheelchair propulsion outcomes was shown in this study. Analyzing data with a small number of pushes for wheelchair propulsion results in a high variability. The CV and max variability results show that researchers using 3, 5, or even 10 pushes for analysis may not be enough (Figure 4). These graphs show the high variability of peak force for 3 pushes, which decreases rapidly to 15 pushes then descends gradually through 30 pushes. Using 3, 5, 10, and 15 pushes resulted in a CV for peak force of 5.7%, 4.4%, 3.5%, and 3.0% respectively.
 |
|---|
Variation could be significantly reduced in propulsion studies through the adoption of a maximum CV threshold. A tradeoff exists between the number of pushes used in a protocol and the amount of time required for testing. Based on the relatively exponential decay in variability found in peak force, the cost of using at least 15 pushes appears to be low compared to the benefits in reduced variability. A first approximation of a maximum CV threshold might be 3%, which would require at least 15 pushes.
One limitation of this study is that it was performed using only one subject who could present more or less variability in his propulsion technique than other manual wheelchair users. Future studies will be performed using more subjects, at multiple velocities and grades. This research will lead to a better understanding of variability in wheelchair propulsion outcomes and will provide a scientific basis for the number of pushes analyzed in biomedical research.
References
- Rogers,M.M., Keyser,R.E., Rasch,E.K., Gorman,P.H., Russell,P.J. (2001). Influence of training on biomechanics of wheelchair propulsion. J Rehabil R&D. (38) 505-511.
- Boninger M.L., Cooper R.A., Baldwin M.A., Shimada S.D., Koontz A.M. (1999). Wheelchair pushrim kinetics: body weight, and median nerve function. Arch Phys Med Rehabil, (75), 513-518.
- Richter W.M., Axelson P.W., Cooper R.A. (2003). A segmental analysis of work during propulsion. Proceedings of the RESNA 26th International Annual Conference. Arlington, VA: RESNA Press.
Acknowledgements
This research was funded by the National Center for Medical Rehabilitation Research in the National Institute of Child Health and Human Development at the National Institutes of Heath through Small Business Innovation Research Phase II Grant #2 R44 HD36533-02A2. Additional support was provided by the College of Engineering, Technology and Computer Science, Tennessee State University, Nashville, TN.
Russell Rodriguez
rrodriguez@mytsu.tnstate.edu
Nashville, TN
(615)
837-6902