Grigor Kerdanyan, MSME, Jean Minkel, PT, Somboon Maneekobkunwong, MSME, Robert Waters, MD, Samuel Landsberger, ScD.
ABSTRACT
To evaluate the ride quality in manual wheelchairs with and without suspensions, a Test Fixture has been built to simulate both uneven pavement and curb drops. Various wheelchairs have been instrumented with load cells and accelerometers. Load cells measure the forces acting on the body through the seat and backrest. Accelerometers measure wheel hub, seat frame and user’s head accelerations. The data acquisition system is mobile and can be used outdoors to collect real world data. Two test sessions have been conducted with 11 subjects comparing Quickie GPV (rigid) and Colours Boing (suspension) chairs. Phase I data indicates that the suspension chair provides lower forces and accelerations from the same disturbances. Our intent is to utilize test data to determine chair design characteristics most influencing performance and validate measurable benefits of suspension systems, including cushions, tires and front casters. We are working with chair manufacturers to thereby improve designs to optimize comfort, while minimizing additional weight, complexity and cost.
KEYWORDS
Wheelchair comfort, suspension wheelchairs, instrumented wheelchairs
BACKGROUND
Wheelchair comfort has been of growing concern as users become increasingly active over a longer lifespan. Wheelchair ride quality has a great effect on back and neck pain for wheelchair users (1). It is also suspected that the added loads of a harsh ride can contribute to pressure sores. Wheelchair manufacturers have addressed this concern with designs using innovative frames and suspension systems. Our intent is to develop an objective way of measuring wheelchair comfort, to compare the performance of different wheelchair designs. This will also give us the ability to compare ride quality using different chair setups such as tire pressure. One of the research groups conducting extensive work in this field is the Human Engineering Laboratories at the University of Pittsburgh, under the supervision of Rory A. Cooper. They have done extensive testing and data collection of vibration experienced during manual wheelchair use (2, 3). We aim to both replicate and build upon their fine results to improve chair design.
METHODOLOGY
Our methodology is to characterize wheelchair suspension performance utilizing a hybrid of objective laboratory data and “expert rider” evaluations of comfort and ride characteristics. This report presents our methods for collecting objective data and lists some limitations, along with preliminary results.
Hardware Development:
 |
|---|
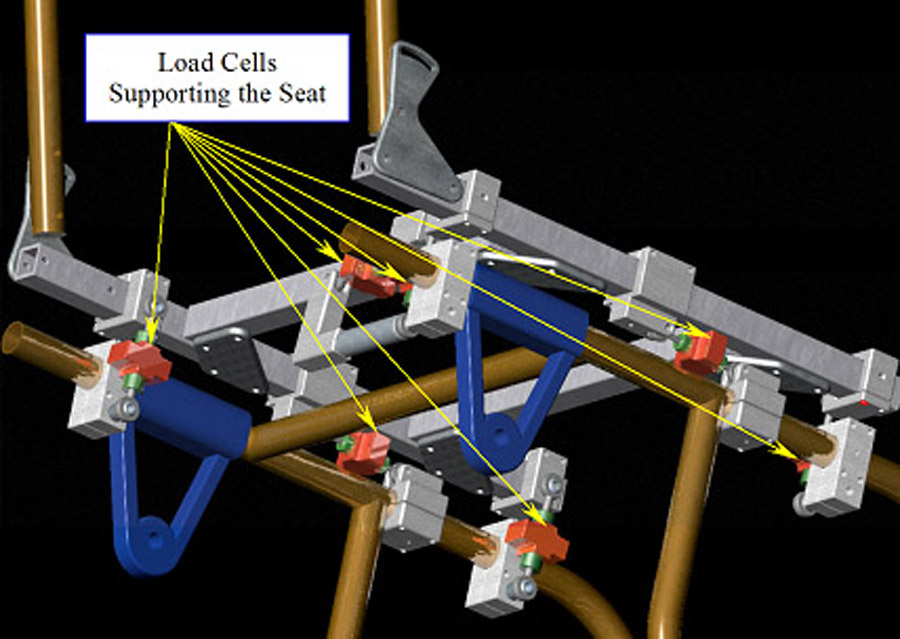
We firstly secured generous manufacturer donations of Quickie GPV and XTR, Colours Boing, rigid and suspended Invacare A4, and TiLite chairs, and subsequently instrumented these to collect data. The instrumentation collects forces and moments acting on the rider through the seat and backrest in all (x,y,z) degrees of freedom. The rider support is connected to the chair entirely by load cells, as seen in Figure 1. To collect acceleration data, we have three 2-axis accelerometers: one on a bicycle helmet worn by the test subject, one mounted on the seat, and one mounted close to the hub of the wheel. This setup provides information of the disturbance entering the chair through the wheel hub, reaching the seat, and finally reaching the user. The data is collected using a laptop computer equipped with data acquisition cards, providing mobile acquisition potential.
 |
|---|
A Test Fixture, Figure 2, was developed to perform two types of controlled disturbance tests. The first test simulates uneven pavement. In this test, a ball/socket joint restrains the front of the instrumented chair while the rear wheels are placed over a rotating drum with a small obstacle fixed to it. The speed, size, shape, and orientation of the obstacle can be varied. A limitation of the test is that the uneven pavement simulator only applies the disturbance to the rear wheels, and the effects of front wheel suspension are perhaps underrepresented. A transfer platform was built to elevate the subject in their chair to the level of the instrumented chair. A second disturbance test utilizes this transfer platform to simulate curb drops. The platform was designed to drop and hit the floor with controlled and measured speed while the subject is on the platform in the instrumented chair. A limitation of this test is that in real curb drops the rider often tilts back and rolls of the curb on the two rear wheels, and performs other movements of her weight perhaps not present with the simulator.
Testing Procedure:
During each test session we test the same rigid chair against one of the suspension chairs. This way we always have the data from the rigid chair as a reference, which allows comparison of data from different test sessions. The subject is weighed, and transferred on to the test chair. The Initial test chair (rigid or suspension) is alternated between subjects. First, we find a drum speed simulating their own pushing speed on uneven surfaces and collect the data for about twenty seconds. Following the drum test, the subject moves back on to the elevation platform for the drop test. We set a drop speed that is comfortable for the subject and collect data for five drops. If the subject is comfortable going down curbs, we collect the data for five curb drops. The subject is instructed to keep each drop as identical as possible. For testing of the second chair the drum speeds, the drop speed, and the curb height are unchanged.
RESULTS
Preliminary data are presented for the Quickie GPV (rigid) and Colours Boing (suspension) chairs. Note that positive force indicates the support of the person on the seat. During steady conditions, this value is the person’s weight, and serves as the reference point. During a curb drop, when the chair is in fall (downwards acceleration), the value will be reduced. When the chair hits the ground, the value will go to a higher value as the seat absorbs the downward momentum of the body, accelerating it upwards . For the acceleration data, negative values indicate downward acceleration.
Drum Test:
 |
|---|
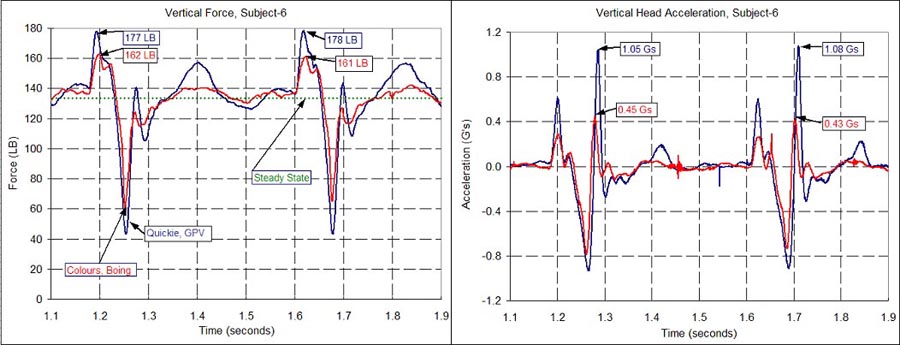
The drum test simulating uneven pavement demonstrates a clear performance difference between the two chairs. Figure 3 and Table 1 show vertical force and vertical head acceleration, for two bumps, collected with the Boing and GPV, with identical cushions, tires and tire pressure. The obstacle was hitting the tire at 2.5 mph. The weight of the subject on the seat was 134 lb, the remainder is on the foot rest. (Subject’s total weight was 149LB). A separate drum test was performed for the rigid chair in which the tire pressure was varied. For a 155 pound subject experiencing a given bump, the peak forces ranged from 183 lb at 50 psi, to 194 lb at 100 psi. This test confirmed, repeatably, both the instrument sensitivity and the importance of tires as suspension elements.
| Weight (Static) | Peak seat Force | % Increase over Weight | Peak Accelleration | ||
|---|---|---|---|---|---|
| GPV | 134 lb. | 178 lb. | 32.8% | 1.06 Gs | Peak accereleration in GPV is 2.3 times that of the Boing |
| Boing | 134 lb | 161 lb | 20.1% | 20.1% |
Curb Drop Simulation:
 |
|---|
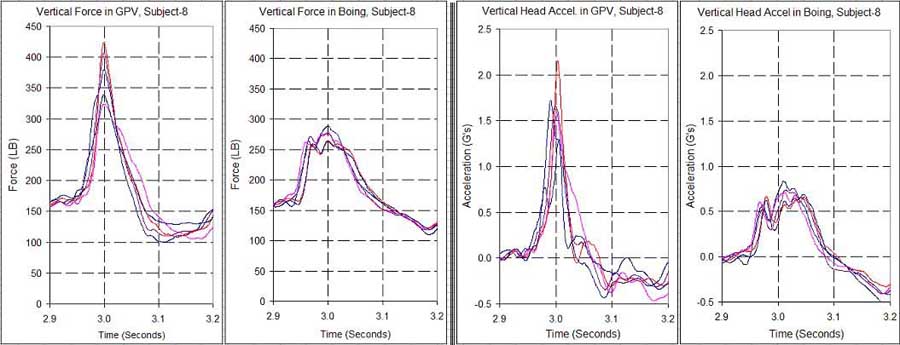
The curb drop simulation does not provide as obvious a difference as in the drum test. The reason for this is that in the drum tester, or in an actual curb drop, the rear wheels take most, if not all, of the impact, while in our simulation the chair is sitting on the platform with all four wheels, and the load is distributed between the rear wheels and the front casters. For this reason, the outcome of the test was affected by the seating position of the subject. Also, some subjects could tolerate very low drop speeds, .5 mph impact velocity range, so that these tests produced very similar loads and accelerations between the two chairs, as the small forces are not sufficient to overcome friction in the suspension components. However, in the tests where subjects could tolerate higher drop speeds, 1.0 mph range, the difference in force and acceleration could be seen in Figure 4. There is about a 67 % difference in force and an 87% difference in acceleration between the two chairs.
Real Curb Drop:
 |
|---|
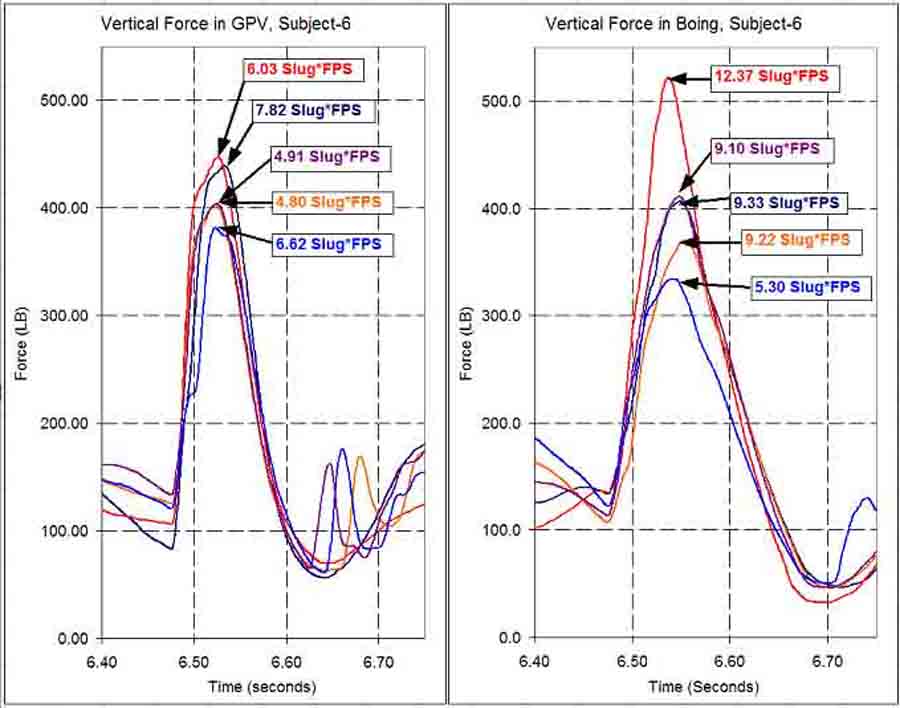
The results of a real curb drop test were the most puzzling, since visual observation of the test clearly indicated that the suspension was working, yet the measured peak force was very close between the rigid and suspended chairs. More careful analysis, calculating area under the force vs. time plot to yield momentum, revealed that subjects were going of the curb more aggressively with the suspension chair than with the rigid chair. Thus, analysis showed that the impact momentum of the Boing chair is higher than that of the Quickie, Figure 5. This suggests that the subjects may have a peak force level that is tolerable, and that during the test, instead of keeping the drops identical, riders may tend to drop so as to produce the same force level. The data of subject 6 indicates that the suspension chair produced the same peak force even though the impact momentum in the suspension chair was 89% higher than in the rigid chair.
DISCUSSION
The preliminary data illustrates differences between the suspension and rigid chair. In the bump tester the differences are most obvious. However, some of our test procedures would benefit from improvements, as noted in discussions of the bump and curb drop testers, particularly relating to the influence of front wheel suspensions. Measuring the impact velocity in the real curb drop test will also provide valuable data. Testing the remainder of the instrumented chairs will also give us an idea of how different each chair performs and will put the collected data in perspective. We also have been working on creating computer models of wheelchair and rider systems. Once we have refined models, they will help us better understand the behavior of the chairs when exposed to disturbances, what influences that performance, and assist us in improved designs for suspensions.
REFERENCES
- Chelgren M, Letter from the inventor. Tapping Technology – Product Reviews, 1999.
- DiGiovine C, Cooper, R, “Analysis of Whole-Body Vibration During Manual Wheelchair Propulsion using ISO Standard 2631.” Proceedings of the RESNA Conference, June 25-29, 1999, pp 242-244.
- DiGiovine C, Cooper, R, Wolf E, Hosfield J, Corfman T, “Analysis of vibration and comparison of four wheelchair cushions during manual wheelchair propulsion.” Proceedings of the RESNA conference, June 28 – July 2, 2000, pp 429-431.