The Adaptation and Calibration of the SMARTHUB for Measuring Ground Reaction Forces on Manual Wheelchairs
Meghan Donahue, Erik Wolf, PhD, Rory Cooper, PhD
INTRODUCTION
The human body constantly undergoes vibrations. It vibrates at its own natural frequency and can undergo additional vibrations from its surroundings. Whole-body vibration is defined by Griffin as “a mechanical vibration or shock transmitted to the body as a whole often due to the vibration of a surface supporting the body (1, p. 27)” When vibrations act on the human body, they are not restricted to the point of contact with the vibrating surface. Three common effects of the stresses that the vibrations induce on the body are discomfort, interference with activities and health impairments. (1)
Improvements have been made to manual wheelchairs to enhance comfort for the user. Challenges in design improvement are a result of lack of quantitative data describing the dynamic loading experienced on the wheelchair. The SMARTHUB has been designed to measure the forces that are transmitted to the wheelchair from surfaces and obstacles that the wheelchair encounters throughout daily use. These forces can be used to calculate the whole body vibrations experienced by the user leading to further improvements in wheelchair designs. (2)
Measurement of acceleration in the vertical and horizontal planes can be correlated with the forces and moments experienced at the same time measured on the SMARTHUB. A SMARTACCLEROMETER can be used in the seat of the wheelchair to measure the vibrations that are transmitted through the seat of the chair to the trunk of the occupant. (3)
A disadvantage of the SMARTHUB is its interface with the computer requires a physical connection. This connection limits the range of motion that the wheelchair can record data over as it can only be used near the connected computer. This makes it challenging to use the device for assessing vibrations during typical daily wheelchair use. Modifications can be made to the SMARTHUB so it can collect data over long periods of time during regular manual wheelchair use. (2)
The purpose of this study is to modify and calibrate the SMARTHUB after incorporating wireless techniques and to apply and calibrate a SMARTACCLEROMETER to measure the forces and vibrations on the manual wheelchair over various obstacles. The forces are coupled with the vibrations and can be used to determine a frequency spectrum of vibration exposure for each of the obstacles. This knowledge can be applied to improve designs in future wheelchairs for targeted frequencies that minimize harm to the user.
METHODS AND RESULTS
Instrumentation of Wheel Hub
Using VanSickle’s techniques for the SMARTHUB Ground Reaction Force Sensor (2); each of the three beams in the wheelchair hub were fitted with four strain gauges, one on each side of the beam. Each of the strain gauges were centered both vertically and horizontally on the beam. The strain gages opposite each other were connected into Wheatstone bridges. There were six bridges total. Each bridge was numbered and corresponded to a channel on the data logger. The hub was designed so that the wheel rotates around it; the beams and Wheatstone bridges are stationary relative to the wheelchair frame. The hub was positioned on the chair such that the beam having Wheatstone bridges corresponding to channels one and two was horizontal to the ground and directed outward from the center of the wheel towards the back of the chair. A triple-axle accelerometer was fixed to the chair to measure acceleration in the vertical direction as well as forward-backward direction relative to the chair.
Data Collection
An Onset Computer’s Tattletale Model 8 Data Logger was used to collect data. This was connected to an amplifier board composed of six instrumentation amplifiers connected to six 8-bit analog to digital converter input channels. The accelerometer was also connected to two 8-bit analog to digital converter input channels- one for the y-direction and one for the z-direction. A potentiometer was connected to each instrumentation amplifier to balance the Wheatstone bridge. When the hub was resting and unstressed, the voltage produced by the Wheatstone bridge was in the middle of the amplifier’s active region. Another major component of the circuitry was the switch that started data collection when power is momentarily applied through it. A program was written for the data logger so that it sampled all 6 bridges and accelerations in the y and z directions concurrently at a rate of 200Hz and stored. The data could be retrieved at a later time for analysis.
Calibration of the Accelerometer
 Figure 1 – Calibration Curves for Y and Z Accelerations (Click image for larger view)
 To calibrate the accelerometer, two minutes of acceleration data was collected at 200Hz. The accelerometer was held steady in all planes so that one unit of gravity acted in one direction. Thus, data was collected for +9.81 meters per second per second, -9.81 meters per second per second and 0 meters per second per second along the y and z-axis. The corresponding voltage outputs for each acceleration were graphed to create a linear equation that relates the voltage to the gravity. Figure 1 shows the relationship for both the y and z-axis. Equations 1 and 2 mathematically describe the relationship.
Equation 1 - Linear Relationship Between Gravity and Y-Axis Acceleration
Acceleration (m/s2 ) = (0.0051(Voltage (mV)) - 12.838) * 9.81
Equation 2 - Linear Relationship Between Gravity and Z-Axis Acceleration
Acceleration (m/s2 ) = (0.0049(Voltage(mV) - 11.921)*9.81
Calibration of SMARTHUB
The hub was calibrated on the Materials Testing System (MTS). A sequence was programmed into the MTS to ramp down onto the hub and apply a 200 lb force at a rate of 1Hz for 10 seconds. Then it applied the same force at a rate of 3Hz for 5 seconds before removing the force for 10 seconds. This was repeated three times per trial and the data logger recorded the output voltages throughout. First horizontal calibration was done; the hub was placed so the beam with channels one and two was along the same axis as the piston of the MTS. Then the hub was rotated 90 degrees to allow calibration in the vertical direction. Last, the hub was flipped on its side so the same sequence of forces could be placed along the axle of the hub, in the medial-lateral direction.
As the voltages were forces measured in A/D units, they were summed in the directions that the forces were applied and the resultant force on the hub measured by the strain gauges was graphed against the applied force of the MTS. The resulting relationship was used to convert the voltages to tangible forces.
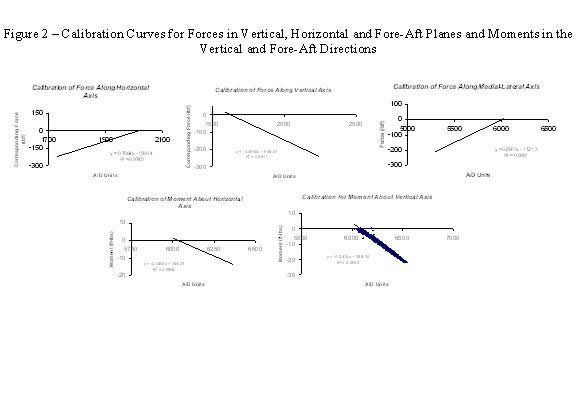 Figure 2 – Calibration Curves for Forces in Vertical, Horizontal and Fore-Aft Planes and Moments in the Vertical and Fore-Aft Directions (Click image for larger view)
 Moments were also determined; the hub was free to rotate around the axle but there were moments around the axes perpendicular and parallel to the ground. The sequence was applied at the outer edges of the hub and the resulting voltages were summed and multiplied to the moment arm to determine the resulting moment. Figure 2 shows the resulting curves from the force and moment calibration and Equation 3 is the calibration matrix that converts the datalogger’s output to forces and moments.
 Equation 3 – Conversion of Datalogger Output to Horizontal, Vertical and Medial-Lateral Forces (lbf) and Moments about the Vertical and Horizontal Axis (foot-lbs) d (Click image for larger view)
CONCLUSION
With the adaptation and calibration of the SMARTHUB, it can be used to measure the forces and vibrations exerted on the manual wheelchair user while the user performing normal daily activities. With its portability, it can be taken out of the testing laboratory and used in a natural environment. Data collected can be converted to forces, moments and accelerations and later used in future studies that analyze the vibrations for wheelchair comfort.
REFERENCES
- M.J. Griffin. Handbook of Human Vibrations, Academic Press Inc., San Diego, CA 1990 pgs 27-42
- D.P. VanSickle, R.A. Cooper, J. Gonzalez, M.L. Boninger. SMARTHUB and SMARTCASTOR Force and Moment Sensing Wheelchair Wheels, Engineering in Medicine and Biology society Vol. 4, 1997, 1871-1874
- D.P. VanSickle, R.A. Cooper, M.L. Boninger, C.P. DiGiovine. Analysis of Vibrations Induced During Wheelchair Propulsion, Journal of Rehabilitation Research and Development Vol. 38, 2001, 409-421
ACKNOWLEDGEMENT
This study was partially supported by the American Student Placements and Internships in Rehabilitation Engineering (NSF EEC 0552351)
Highlights
- Source Ordered
- No Tables
- Very Compatible
Gargoyles
Disney produced a television show in the mid 1990s called Gargoyles. It's a great show and I'm a big fan. A few years ago Disney started to release the show on DVD. The last release was of season 2, volume 1. That was two years ago. Volume 2 has not been released. Why? Poor sales. So if you should find yourself wanting to support my work, instead I ask you pick up a copy of season 2, volume 1. It's a great show and you might find yourself enjoying it.