Effect of Wheelchair Headrest Use During Rear Impact on Pediatric Head and Neck Injury Risk Outcomes
Susan I. Fuhrman, BSME1 , Patricia Karg MSBME1 , Gina Bertocci, PhD2
1 University of Pittsburgh, Pittsburgh, PA 2 University of Louisville, Louisville, KY
Abstract
Wheelchair transportation safety research has primarily addressed frontal impact consequences. This study is a first, examining effects of headrest use on pediatric injury measures under rear impact conditions. Two sets of three identical WC19 transit-option manual pediatric wheelchairs were tested: three sled tests were conducted without a headrest and three with a headrest. All tests used a 26 km/h, 10 g rear impact test pulse, seated Hybrid III 6-year old anthropomorphic test device (ATD), and 4-point strap-type surrogate wheelchair tiedowns and 3-point occupant restraints (WTORS). Results suggest a lower risk of head and neck injury with wheelchair headrest use.
KEYWORDS:
wheelchair transportation safety, rear impact, pediatric injury risk, neck injury criteria, head injury criteria
Introduction
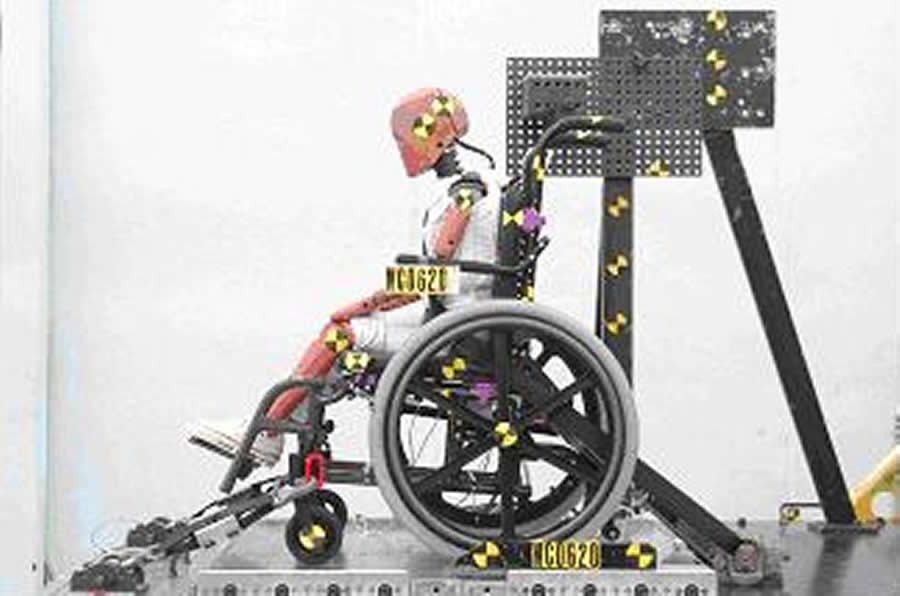 Figure 1: Wheelchair set-up without a headrest (Click image for larger view)
 Many wheelchair users are unable to transfer to a motor vehicle seat and remain seated in their wheelchairs during transportation. A goal is to make transportation in a motor vehicle as safe for those who travel in wheelchairs as it is for those who travel in original manufacturer installed vehicle seats. Historically, most wheelchair transportation safety research has focused on frontal impact events. Yet, while most fatalities from motor vehicle accidents do occur in frontal impact, rear impact accounts for the greatest number of occupant related injuries [1, 2]. In response to this concern, vehicle manufacturers have focused research efforts on developing effective head restraints [3, 4]. Our research [5] has indicated that wheelchair headrests are prescribed for over 60% of all wheelchair users, and for 80% of all pediatric wheelchair users. However, there has been no previous effort to investigate the effects of wheelchair headrest use for pediatric wheelchair-users in rear impact.
 Figure 2: Wheelchair set-up with headrest. Arrow indicates pin location. (Click image for larger view)
 Several different measures have been used in an effort to predict likelihood of human injury based on measurable criteria. Both physical and mathematical models of the head or head and neck, have been used to establish measurable parameters to assess injury risk [6, 7]. Maximum head acceleration, head injury criteria (HIC), neck injury criteria (Nij), rotational head velocity, rotational head acceleration are all measures that have been used in an effort to predict injury likelihood [8].
The purpose of this investigational baseline study was to establish quantitatively the potential benefit or harm of using a postural headrest for a wheelchair-seated pediatric occupant during rear impact. This was evaluated by comparing outcomes to a variety of injury risk measures.
Methods
Six identical Sunrise Medical Quickie Zippie transit-option (ANSI/RESNA WC19 [9]) pediatric manual wheelchairs (17.9 kg) were tested: three without headrests, three with identical Sunrise Medical single-pad headrests (Table 1).
| Sled Test | Wheelchair configuration |
|---|---|
| 1 | No headrest |
| 2 | No headrest |
| 3 | No headrest |
| 4 | Sunrise Medical single pad headrest |
| 5 | Sunrise Medical single pad headrest |
| 6 | Sunrise Medical single pad headrest |
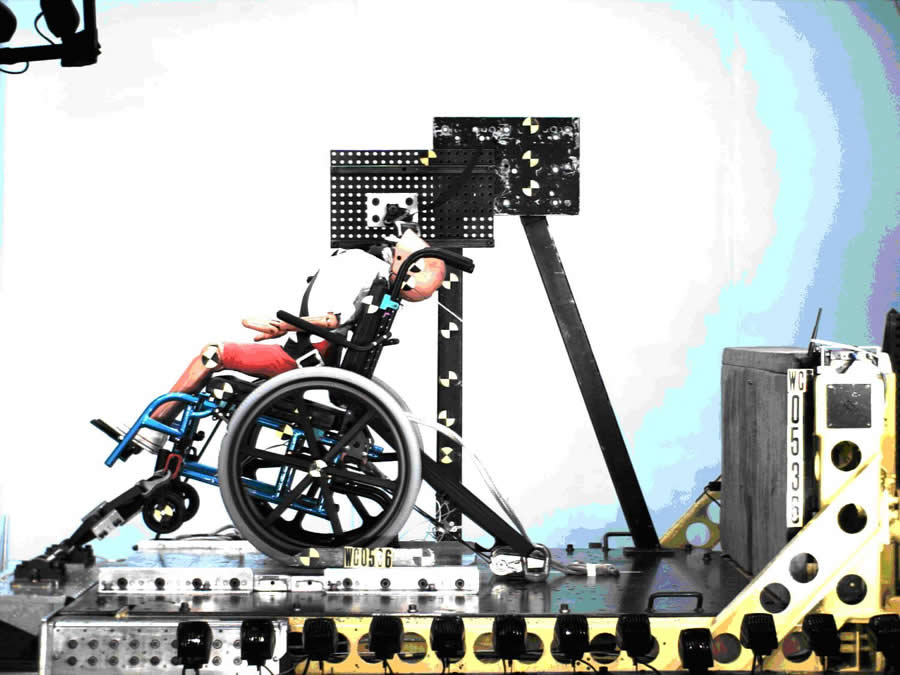 Figure 3: Maximum neck extension for Test 2 with no headrest (Click image for larger view)
 All wheelchairs were tested with a seated Hybrid III 6-year old ATD using a 26 km/h, 10g rear impact crash pulse. Wheelchairs were secured using four-point strap-type surrogate wheelchair tiedowns; the ATD was restrained with a three-point occupant restraint system [9]. At the time of testing, the crash pulse conformed with the then proposed ISO test pulse for use in development of a draft voluntary industry standard for wheelchair performance evaluation in rear impact [10]. All wheelchairs were equipped with matched components and identically configured. A pin, inserted in the Sunrise Medical headrest stem joint, prevented headrest anterior-posterior slippage during rear impact. (Figure 2))
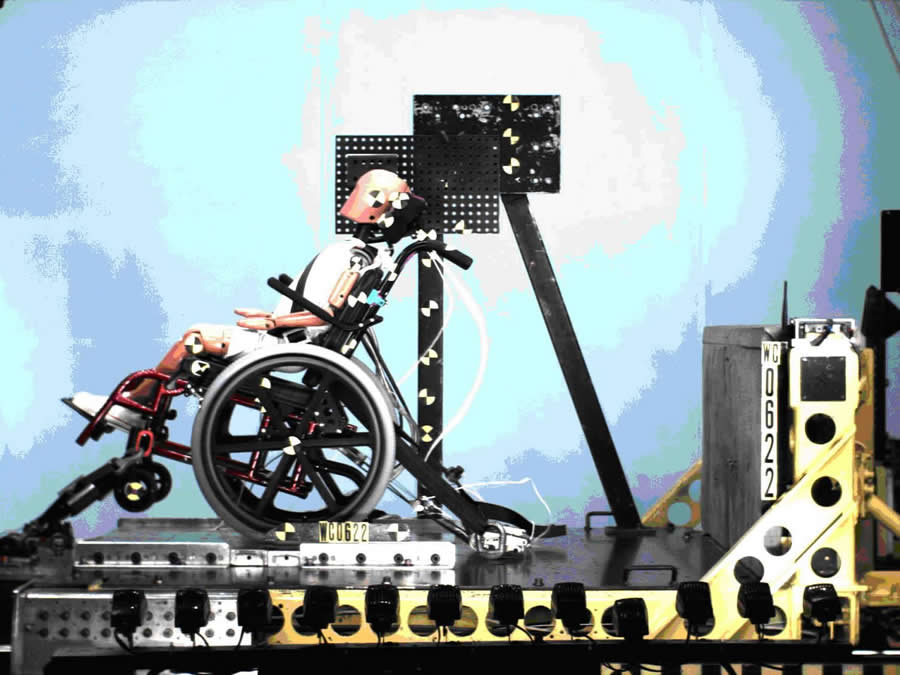 Figure 4: Maximum neck extension for Test 5 with a headrest (Click image for larger view)
ATD instrumentation included a triaxial accelerometer positioned at the head CG to measure head accelerations; an upper neck load cell measured neck loads and moments. High-contrast markers, placed on the ATD head (2), shoulder and knee, indicated position throughout the test. High-speed video cameras (1000 frames/sec) recorded the test. Transducer data were recorded every 0.1 ms and filtered according to SAE J211.
Kinematic data from the tests described ATD response to rear impact. A Matlab program was used to acquire and track high-contrast marker location coordinates [11]. Kinematic data from video images were used to calculate rotational head velocity, and peak rotational head acceleration, which were compared to diffuse axonal injury (DAI) criterion, introduced by Margulies [12]. DAI is associated with maximum change in angular velocity and peak angular accelerations.
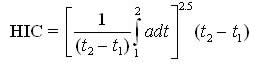
Transducer output for head acceleration, neck loads and neck moments, were used to calculate head injury criteria (HIC) values and neck injury criteria (Nij) values. HIC values were calculated using Equation 1 [13]. HIC15, HIC36 and HICun were calculated using corresponding millisecond time intervals.
Nij establishes critical limits for neck axial loading and bending moments. Nij was defined by [14]:
Fz = axial load
Fint = critical intercept load value used for normalization
My = bending moment
Mint = critical moment intercept value used for normalization
Results
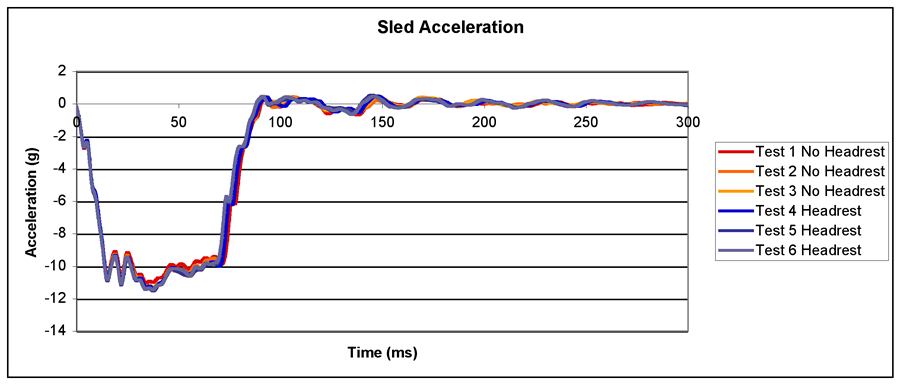 Graph 1: Sled acceleration profile (Click image for larger view)
In all tests, sled acceleration plateau average levels were between -9.6 g and -10.0 g, sled acceleration peaks between -11.0 g and -11.6 g, and sled change in velocity (delta-V) between 25 km/h and 25.6 km/h. Graph 1 shows sled test acceleration profiles and sled acceleration pulse reproducibility.
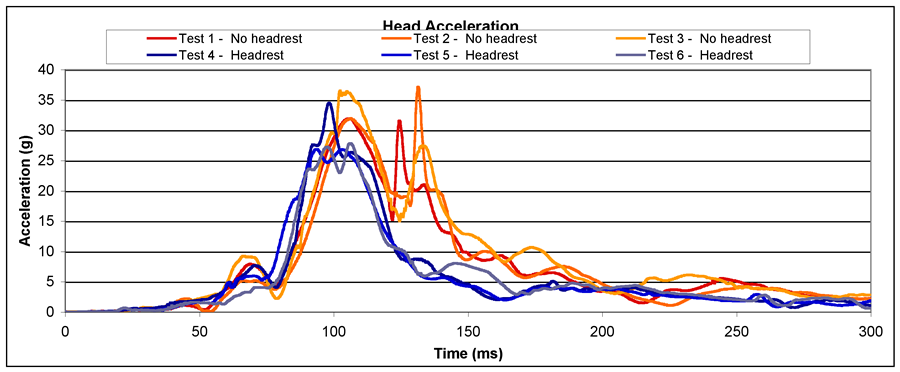 Graph 2: Translational head acceleration (Click image for larger view)
The Zippie wheelchairs remained structurally intact and the ATD maintained an upright posture throughout all rear impact tests. Initial evaluation of sled test video images (Figures 3 and 4) suggests a neck extension reduction with headrest use.
Head acceleration results (Graph 2) show higher peak head accelerations and longer duration of these accelerations during sled tests 1-3 lacking headrests when compared against tests 4-6 with headrests. Tests 1-3 show secondary acceleration peaks occurring during head-seatback contact. When compared to a proposed head acceleration protection reference value (PRV) of 80 g, [6] a low probability of associated head injury is predicted.
 Graph 3: Head injury criteria values (Click image for larger view)
Peak head acceleration and associated duration is used in computing HIC. HIV value results for 15 ms, 36 ms, and the complete test are indicated in Graph 3. The HIC PRV for the 6-year old ATD are: HICun is 1000, HIC36 is 1000, HIC15 is 700; these levels are associated with a 23% chance of maximum abbreviated injury scale (MAIS) injury level > 3 [6]. Tests 4-6 conducted with headrests yielded average HIC values 34% lower than tests 1-3 conducted without headrests, although all HIC values were below PRVs.
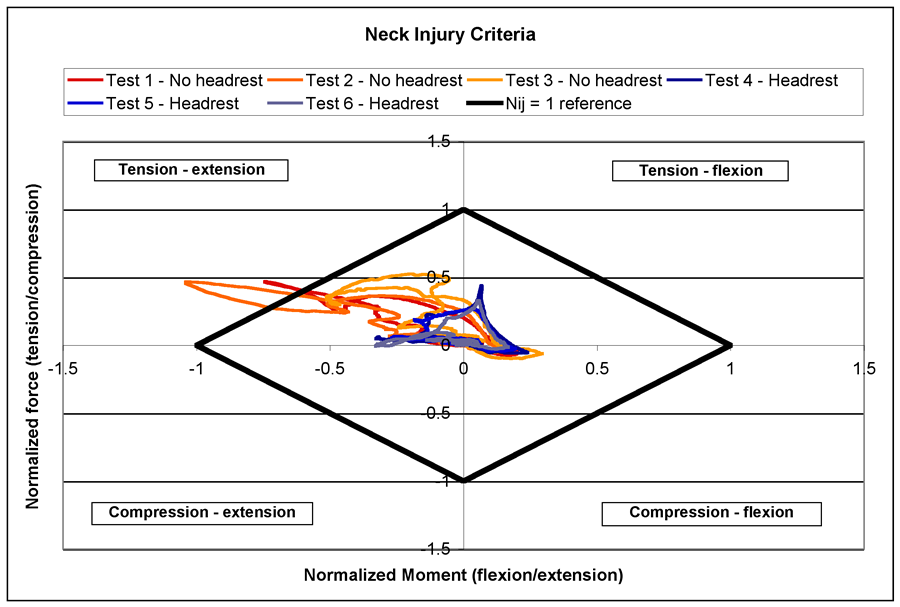 Graph 4: Neck injury criteria (Click image for larger view)
Graphs 4 and 5 highlight improved neck response with headrest use. Nij > 1 is associated with 22% serious injury probability (abbreviate injury scale > 3) [15, 16]. The mechanism of greatest concern during rear impact is the tension-extension portion of Nij. Our findings show that Nij results indicate ATD neck response in rear impact without a headrest exceeds PRV Nij=1. This occurred when the ATD neck reached maximum extension. Tests with headrests had 70% average reduction in Ntension-extension over tests without headrests.
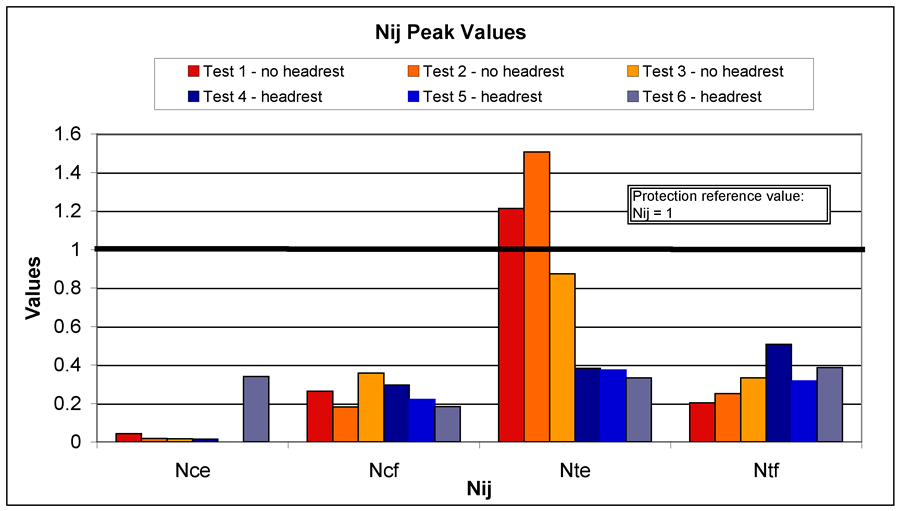 Graph 5: Nij peak values (Click image for larger view)
Both peak rotational head velocity change (Graph 6) and peak rotational acceleration (Graph 7) show that headrests reduce the rotational effects on the head. The rotational head response PRVs, not firmly established but cited by Klinich [6] based on Ommaya’s work [17], are associated with AIS > 3. In both graphs, values for tests without headrests exceed PRVs; those with headrests are close to PRVs. Tests 4-6 with headrests averaged 51% reduction in change in rotational head velocity, and 36% reduction in rotational head acceleration.
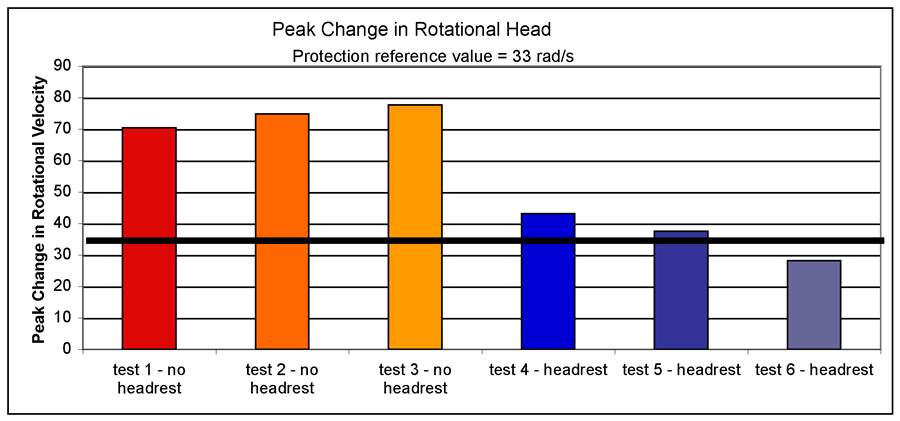 Graph 6: Peak change in rotational head velocity (Click image for larger view)
As noted in the DAI graph (Graph 8), all tests were below the injury threshold, with headrest-containing tests falling lowest.
Discussion
This exploratory study of pediatric ATD response during rear impact demonstrates that use of a slightly modified commercially available wheelchair headrest designed solely for postural support has the potential to provide improved head and neck protection during rear impact. Each injury outcome measured, showed peak value reductions for tests with headrests; HIC, Nij, rotational head velocity, and rotational head acceleration all showed reductions in excess of 34%, and in some cases as high as 70%. This is a significant finding of this study since three-fourths of pediatric wheelchairs are prescribed with headrests and some school systems require wheelchair users to have a headrest for transportation purposes [5, 18].
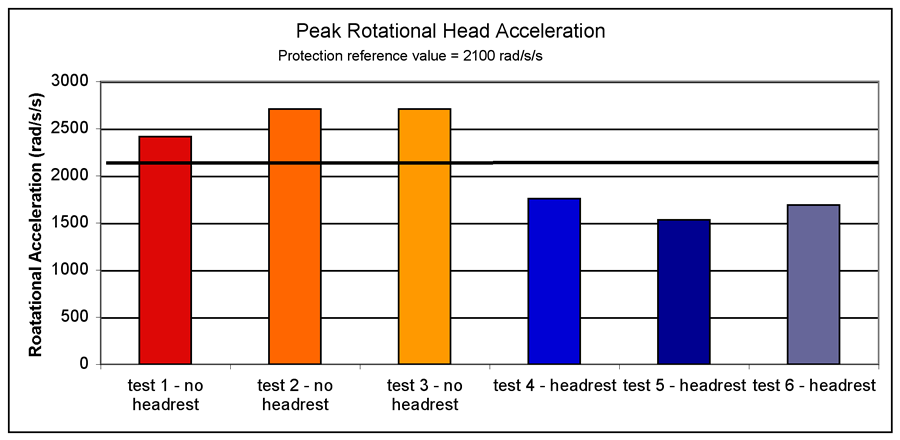 Graph 7: Peak rotational head acceleration (Click image for larger view)
It is important to note that there are some limitations associated with this study. Use of the ATD has limitations intrinsic with ATD biofidelity, especially with respect to ATD neck response. The Hybrid III 6-year old ATD neck has come under scrutiny for its response characteristics [19]. Many of the injury criteria PRVs used in this study were initially developed for the 50th percentile male and scaled for smaller ATDs. Many scaling parameters were based on limited testing. Furthermore, DAI injury criteria were derived from primate testing.
ACKNOWLEDGEMENTS
 Graph 8: DAI injury risk (Click image for larger view)
This study was funded by the National Institute on Disability and Rehabilitation Research (NIDRR) and the Rehabilitation Engineering Research Center (RERC) on Wheelchair Transportation, grant # H133E010302. The opinions expressed herein are those of the authors and are not necessarily reflections of NIDRR opinions. Thanks to Miriam Manary for her input to sled impact testing.
Susan I. Fuhrman
Department of Rehabilitation Science and Technology
2310 Jane Street, Suite 1300
Pittsburgh, PA 15203
(412) 586-6920, (412) 586-6910 (fax),
sif3@pitt.edu
REFERENCES
- Japan Traffic Safety Association, Traffic Greenpaper. 1997. p. 115-118.
- NHTSA, Preliminary Assessment of NASS CDS Data Related to Rearward Seat Collapse and Occupant Injury. 1997, NHTSA: Washington, DC.
- Saab. Features and Specifications: Safety & Security. 2006 [cited April 5, 2006]; Available from: http://www2.saabusa.com/95s/features.asp?start=home.
- Johansson, S. Volvo for life: safety firsts. 2006 [cited April 5, 2006]; Available from: http://www.volvocars.us/_Tier2/WhyVolvo/Safety/SafetyFirsts.htm.
- Fuhrman, S.I., M.E. Buning, and P. Karg. Prescription patterns of secondary postural support devices and concerns related to their used during vehicle transportation. in RESNA 2005. 2005. Atlanta, Georgia: RESNA.
- Klinich, K.D., et al., Techniques for developing child dummy protection reference values, Child Injury Protection Team, Editor. 1996, General Motors.
- McLean, A.J. and R.W.G. Anderson, Head Injury, ed. P. Reilly and R. Bullock. 1997, London: Chaoman & Hall. 25 - 37.
- Nahum, A. and J. Melvin, Accidental injury-biomechanics and prevention. 1993, NY: Springer-Verlag.
- ANSI/RESNA, ANSI/RESNA WC-19: Wheelchairs Used as Seats in Motor Vehicles. 2000, American National Standards Institute (ANSI)/Rehabilitation Engineering Society of North America (RESNA).
- Flannagan, C. and M. Manary, ISO proposed rear impact standards and crash pulse severities, S.I. Fuhrman. November 14, 2005: Ann Arbor.
- Fuhrman, M.G., trackTargetsManually.m. 2005: Pittsburgh.
- Margulies, S.S. and L.E. Thibault, A proposed tolerance criterion for diffuse axonal injury in man. Journal of Biomechanics, 1992. 25(8): p. 917-23.
- McHenry, B.G., Head Injury Criterion and the ATB. ATB Users' Group, 2004.
- Kleinberger, M., et al., Development of improved injury criteria for the assessment of advanced automotive restraint systems. 1998, National Highway Traffic Safety Administration: Washington D.C. p. 114.
- NHTSA, FMVSS 208, Occupant Crash Protection. Vol. 49 CFR 571.208. 1993.
- Eppinger, R., et al., Development of Improved Injury Criteria for the Advanced Automotive Restraint Systems - II. 1999, National Highway Traffic Safety Administration: Washington D.C.
- Ommaya, A.K., The biomechanics of head injury: experimental aspects, in The biomechanics of trauma, A.M. Nahum and J. Melvin, Editors. 1985, Prentice-Hall.
- Smith, D., Discussion on pediatric headrests, S.I. Fuhrman. November 10, 2005: Pittsburgh.
- Sherwood, C.P., et al., Prediction of cervical spine injury risk for the 6-year-old child in frontal crashes. Traffic Injury Prevention, 2003. 4(3): p. 206-13.
Highlights
- Source Ordered
- No Tables
- Very Compatible
Gargoyles
Disney produced a television show in the mid 1990s called Gargoyles. It's a great show and I'm a big fan. A few years ago Disney started to release the show on DVD. The last release was of season 2, volume 1. That was two years ago. Volume 2 has not been released. Why? Poor sales. So if you should find yourself wanting to support my work, instead I ask you pick up a copy of season 2, volume 1. It's a great show and you might find yourself enjoying it.