Simulation of Dynamic Pedorthosis Using Computer Modeling in the Treatment of Clubfoot
R. Rizza1 , XC. Liu2 , J.Thometz2 , R. Lyon2 , S. Kamara1 , C.Tassone2 , and G. Harris2
1 Department of Mechanical Engineering
Milwaukee School of Engineering
Milwaukee, WI
2 Department of Orthopaedic Surgery
Medical College of Wisconsin
Milwaukee, WI
ABSTRACT
Five normal children and five children with residual clubfoot were recruited for this study to establish a pressure matrix database. This pressure matrix in addition to computer modeling was used to simulate the effect of an insert geometry and location on the trajectory of the center of pressure. The custom insert shifts the trajectory of the center of pressure into a normal range. Using a commercial pressure analysis system, sophisticated software was developed as a tool for this simulation. An orthotic will be constructed with this built-in insert to correct the clubfoot deformity.
KEYWORDS
Dynamic orthotic, computer modeling, FEA, center of pressure, clubfoot
BACKGROUND
Clubfoot is a common pediatric orthopaedic deformity. Ponseti’s method, which implements a series of castings and physical therapy, has become popular in the treatment of clubfoot. Despite this fact, there is still an 11% to 47% rate of deformity relapse reported in the literature [(1), (2)]. The Denis-Browne splint and its modifications have been used for decades to prevent clubfoot relapse or as night splints. The technique to make a traditional orthosis is still dependent upon a non-weight bearing casting or foot imprint. These splints outdate clinical treatment trends and only apply to patients who are of non-walking age. No effective walking foot orthotic has been developed to prevent the relapse of clubfoot following non-surgical or surgical treatment.
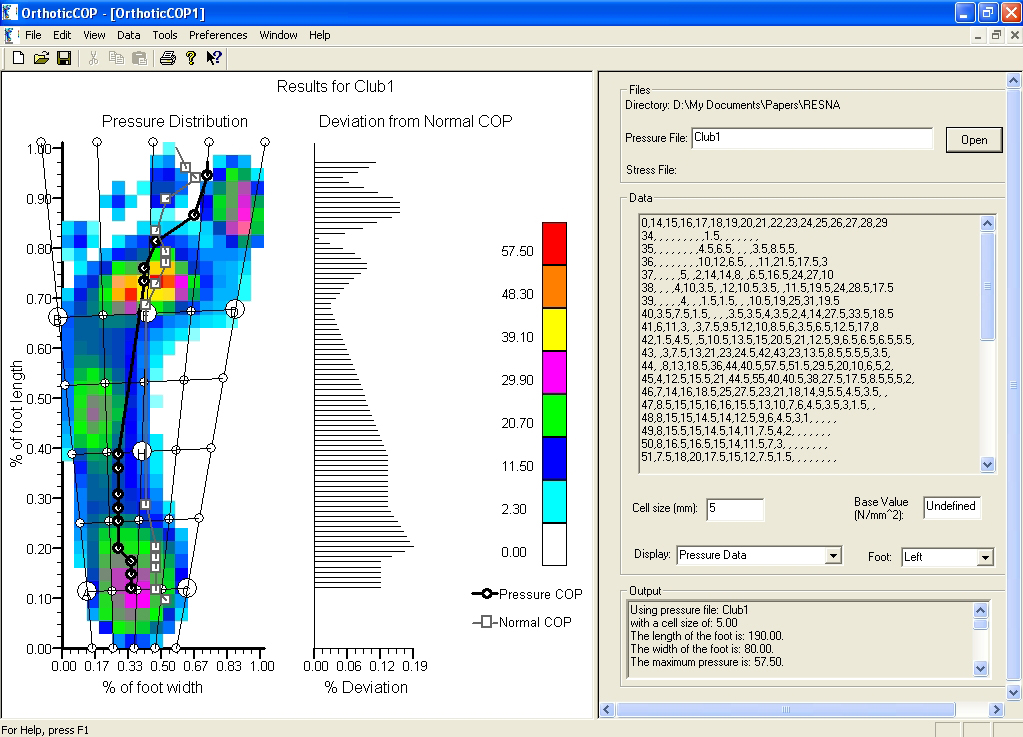 Figure 1: COP Trajectory. The deviation between the normal and clubfoot COP is given as a separate plot. (Click for larger view)
 With current technology in gait analysis, it is possible to measure the contact pressure between a foot and a force plate. The level of clubfoot deformity may then be characterized by taking this pressure distribution and obtaining the trajectory of the center of pressure (COP). The trajectory for a patient with clubfoot deformity is shown in Figure 1. In a normal foot, the center of pressure (COP) starts at the center of the heel goes through the middle of the midfoot and ends between the first and second toe. As can be seen in the figure, the trajectory deviates from the trajectory of an individual with a normal foot.
When a patient wears an orthotic, the contact pressure is affected by the geometry of the orthotic and the material properties of the orthotic. These factors may be modeled by using Computer Aided Design (CAD) and analyzed by employing Finite element Analysis (FEA). So the effect that an orthotic has on the pressure distribution and the trajectory of the COP may be predicted. An orthotic, which has a design and material properties that shifts the COP trajectory toward a normal trajectory, will be the orthotic that corrects the foot deformity. The purpose of this research was to use these advanced technologies to establish a new process to develop a customized dynamic pedorthosis.
METHODS
Five normal children with average age of 7.2-year-old (2 girls and 3 boys) and five clubfoot patients with average of 6-year-old (1 girl and 4 boys) were recruited to obtain dynamic plantar pressure using EMED Pressure System, and three-dimensional geometry from CT scan. All patients were diagnosed as bilateral clubfoot deformities. Treatment history included a posterior medial release for two patients, series casting for two patients, and a complete subtalar release for one patient. Data from the normal children were employed to generate average values for the COP trajectory.
The data from the patients with clubfoot is quantified by calculating the trajectory of the COP and obtaining the deviation of this trajectory from that of the average normal COP trajectory. This is shown in Figure 1. Differences in the plantar contact area and peak pressure between normal children and children with clubfoot were compared. The software shown in the figure was developed during the investigation of this research topic. It has the capability to generate the pressure distribution map, which is needed as an input for the FEA.
A CAD model of a typical orthotic was constructed using Pro/Engineer (Parametric Technology Corporation, Needham, MA). The model contains plastic and foam elements as used in actual orthotics. Then, the CAD model was imported in Patran/Nastran (MSC Software Corporation, Santa Ana, CA) and a FEA model was generated. The pressure distribution map was used as an input to this model and the CAD model was analyzed using FEA.
In house software has also been developed and is used to characterize the results of the FEA analysis. This software is able to digitize the results so that the trajectory of the COP for the candidate orthotic design may be examined.
Experimental tests were carried out to obtain material properties for possible candidate materials from which the orthotic may be constructed. Commercially available foams and polymer materials were evaluated in tension and compression. These tests provide a bench mark for current material properties used in orthotic construction. But, because orthotic is to be constructed using rapid prototyping (RP) technologies, compression tests have been carried out on several RP materials to determine their suitability for use in the construction of the orthotic.
RESULTS
Table 1 shows an increased contact area at the mid-foot, mid-forefoot and reduction in the contact area at the Hallux compared to the normal foot. However, it shows increased peak pressure on the lateral forefoot.
Parameter |
Normal |
Clubfoot |
Probability |
|---|---|---|---|
|
Mean ± SD |
Mean + SD |
|
Contact Area |
|
|
|
Mid-Foot |
10.8 ± 2.3 |
15.4 ± 6.4 |
0.02 |
Mid-Forefoot |
10.8 ± 1.4 |
11.1 ± 3.9 |
0.002 |
Hallux |
6.4 ± 1.3 |
4.2 ± 2.9 |
0.001 |
Peak Pressure |
|
|
|
Lateral Heel |
27.4 ± 4.3 |
18 ± 9.4 |
0.03 |
 Figure 2: Candidate Orthotic designs. The inset shows the wedge insert. (Click for larger view)
 Figure 2 illustrates typical results for a candidate orthotic design. Pressure data for the patient in Figure 1 was used. The figure shows a change in the pressure distribution due to a change in the geometry of the orthotic. Only the bottom of the orthotic is shown. In (a), results are shown for an orthotic with a simple single foam layer. In (b), results are given for an orthotic design that employs a foam wedge to shift the trajectory of the COP. In Figure 2b, the length of the wedge is along the entire length of the orthotic. In this case, not only is the trajectory in the forefoot region shifted but the portion of the trajectory that lies in the hindfoot region is shifted as well.
DISCUSSION
From Table 1, we are able to determine the deviation of the pressure matrix between the normal and the clubfoot, which is the foundation needed to quantify the degree of COP deviation from the normal. This information is used in the construction of the CAD and FEA models.
As shown in Figure 2b, the addition of a foam wedge shifts the trajectory of the COP. This may be easily seen by comparing Figure 2a and Figure 2b. Using the information in Table 1, we can identify that this patient still has residual inversion of the forefoot even after a series of casting and surgical treatment. Before the use of an orthotic with a wedge, the COP was located laterally on the forefoot. Our unique modeling technique simulates a shift in the deviated COP to a normal range of the COP trajectory based on the normal data. In addition, this simulation using computer modeling will be able to predict the location and three-dimensional geometry of the insert required to correct the abnormal COP trajectory. The custom insert from this simulation will be constructed precisely with the rest of the orthotic.
REFERENCES
- Kocher MS, and Newton PO. (2005). What’s new in pediatric orthopaedics. J Bone J Surg Am., 87, 1171-1179.
- Morcuende JA, Dolan LA, Dietz FR, and Ponseti IV. (2004). Radical reduction in the rate of extensive corrective surgery for clubfoot using the Ponseti method. Pediatrics, 113(2), 376-380.
ACKNOWLEDGEMENTS
This study was funded by the National Institute on Disability and Rehabilitation Research grant #H133G060142-01.
Author Contact Information:
Robert Rizza, Ph.D., Milwaukee School of Engineering, Milwaukee, WI 53202, Office Phone (414) 277-7377 EMAIL: rizza@msoe.edu