Driving Ability Following Spinal Cord Injury – Initial Comparison of VR Simulator to Behind-the-Wheel Performance
Venkata Gade, MS, Brianne Smith, BA, Nitin Moholkar, PhD, Eugene Komaroff, PhD, W. Thomas Edwards, PhD, and David Tulsky, PhD
Kessler Medical Rehabilitation Research and Education Center, West Orange, New Jersey 07052
ABSTRACT
A virtual reality driving simulator was used to evaluate driving performance in comparison to actual behind-the-wheel evaluations. The VR driving simulator was equipped with SCI accessible hand controls for acceleration, deceleration, and steering. The simulator includes custom software that utilizes artificial intelligence to simulate “on the road driving.” Twenty-six individuals with traumatic SCI participated, of those 5 did not past the behind-the-wheel assessment. Driving performance was predicted from the simulator results on the basis of number of collisions and driving speed. Comparing groups based on 0, 1, 2 collisions, the proportions were significantly different between those who passed the driving test (77%, 24%, 0%) and those who failed (50%, 0%, 50%). The individuals who failed tended to drive the simulator more slowly than those who passed. This study is one of the first to identify parameters in a VR environment predictive of behind-the-wheel driving performance in an SCI population.
Keywords:
Driving Rehabilitation; Virtual Reality; Spinal Cord Injuries
BACKGROUND
Driver retraining following a spinal cord injury (SCI) is a critical step towards community integration and independence. The application of virtual reality (VR) is a relatively new approach for rehabilitation research (1). In the area of driving evaluation, VR offers the benefit of providing a safe and consistent environment. However, as with all new technologies, it is necessary to determine what parameters best predict meaningful outcomes (2). Real world outcomes must be correlated with parameters measurable in the VR environment.
Currently, driving retaining and evaluation rely on one-on-one interaction with a certified driving instructor and “behind-the-wheel” evaluations. In most cases, driving simulators can not be utilized because they require use of foot pedals which are not appropriate for individuals with SCI. For this reason, a state-of-the-art virtual reality driving simulator with adaptive hand controls for acceleration, deceleration, and steering was developed. The simulator includes a custom VR software program that utilizes artificial computer intelligence to simulate “on the road driving.” This study analyzes initial data on the predictive utility of the VR driving simulator for use in evaluating individuals relearning to drive following SCI. The objective of the study was to compare performance (collisions, reaction times at lights, and speed) in three zones of the VR course (residential, school and commercial) to success in actual behind-the-wheel tests.
METHODS
Twenty-six (26) individuals with traumatic SCI participated in a driving evaluation study using a virtual reality simulator and a behind-the-wheel evaluation. The participants were recruited from the Kessler Driving Program, the Northern New Jersey SCI system, and advertisements in consumer newsletters and included individuals both with and without any experience with hand controls for driving.
The study protocol consisted of a training trial followed by two test trials driving through the VR simulation course as shown in Figure 1. The participants were divided into three groups based on the number of collisions during the VR simulation (group1: no collisions, group2: 1 collision, and group3: 2 collisions). Our initial analyses were focused on the commercial zone. The commercial zone of the VR simulation was divided into two sections (section1: with two traffic signals and a commercial vehicle challenge before approaching 2nd light, and section2: no traffic lights or challenges). The reaction time at a traffic signal is defined as the time (sec) it takes to start moving after the signal turns green. VR performance evaluation included assessment of number of collisions and its relation with the driving speed in the two sections of the commercial zone, and reaction time at the three traffic signals during test trial-2. On a following day, individuals took a behind-the-wheel examination with a certified Kessler Institute for Rehabilitation (KIR) driving instructor. The written evaluation of the driving instructor served as the criterion outcome variable.
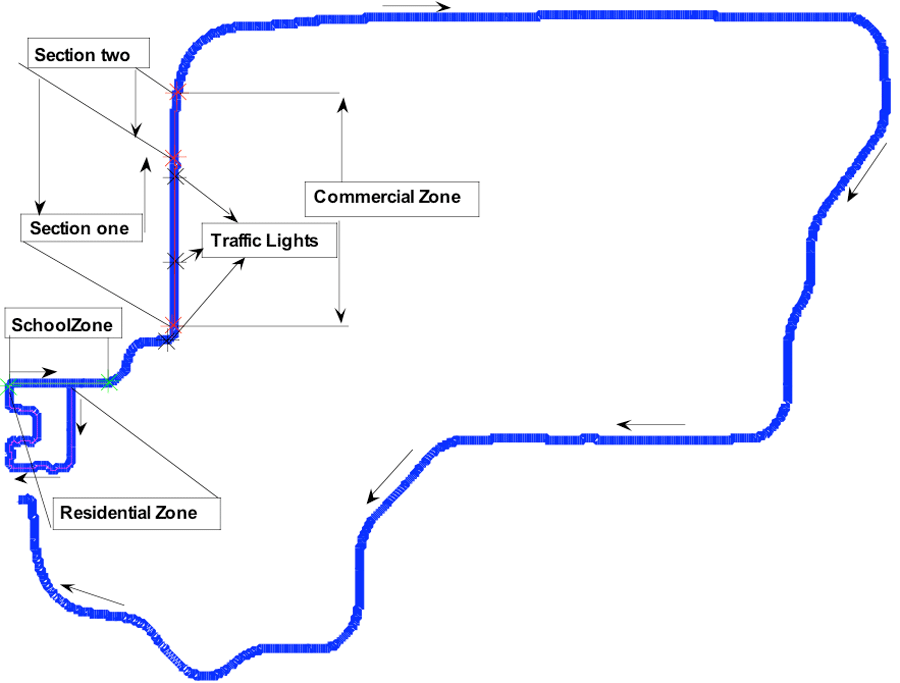
Figure 1. Map of the VR driving course showing the areas studied. (Click for larger view)
Driving performance from the VR simulation was analyzed to see how people with collisions differ in their reaction time at a traffic light and their driving speed in the commercial zone. Performance on the VR driving focused on collisions, scrapes, and adherence to posted speed limits. Statistical comparisons were made using a one-way ANOVA with a post-hoc Fisher LSD test to assess differences between groups.
RESULTS
Driving performance on the KIR evaluation was summarized with a dichotomous (1/0) score representing a good (no remediation or problems noted; N = 22) or bad driver (remediation or recommendation that the individual does not drive; N = 4). One-way ANOVA showed that there is a significant difference in the mean reaction time between the groups only at light 3 (p=0.0428). The post-hoc Fisher LCD test revealed that the difference between the mean reaction time is significant between the group2 and group3 and between group1 and group3 (p<0.05). However, the difference between group1 and group2 was not significant (p>0.05). The repeated measure of ANOVA for the driving speed in the two sections of the commercial zones show that there is a significant increase in speed (p<0.001) as a main effect and a group by time interaction (p=0.0300). Inspection of the means reveals that the people who passed the behind-the-wheel test increased driving speed three-fold between section-1(with traffic lights) to section-2 (no challenges) compared to those who failed who doubled their speed.
The results show that the number of virtual collisions is predictive of poor behind-the-wheel performance. Comparing the groups based on 0, 1, 2 collisions, the proportions are significantly different (Fisher exact test, p=0.0201) between those who passed the driving test (77%, 24%, 0%) and those who failed (50%, 0%, 50%). No driver who passed the behind-the-wheel test had two collisions.
The mean reaction time at a traffic light did not seem to be a significant indicator of the performance behind-the-wheel. The driving speed in the section of commercial zone with traffic lights indicated that the people who failed behind-the-wheel test tend to drive slower in the section of commercial zone with no traffic lights.
| Number of collisions | N pass/fail | Section 1 | Section 2 | ||
|---|---|---|---|---|---|
| Mean | Std Dev | Mean | Std Dev | ||
0 |
17/2 |
10.65 |
0.77 |
28.12 |
5.91 |
1 |
5/0 |
11.54 |
0.75 |
34.11 |
5.22 |
2 |
0/2 |
12.15 |
2.27 |
22.40 |
6.18 |
DISCUSSION
The use of a virtual environment to evaluate driving performance has advantages over traditional behind-the-wheel testing. A VR environment that faithfully replicates driving conditions can provide effective predictions of actual behind-the-wheel performance using a standardized set of measurements for the evaluations (3). A strength of the present VR simulator is that it incorporates the actual hand-controls found in SCI accessible vehicles. This provides a more realistic driving environment.
The analyses presented here focused on three areas of the VR driving course that appeared to be the most challenging. The residential, school and commercial zones each presented different driving challenges. The residential zone provided a course with stop signs and a large number of turns, the school zone include pedestrian crossing and school bus stop sign, and the commercial zone included traffic lights and a challenge to watch for a vehicle pulling in front. The results of the study confirm that collisions during the VR simulation correlate well with behind-the-wheel results stating that the drivers having more collisions tend to fail behind-the-wheel test. No driver who passed the behind-the-wheel test had two collisions. With respect to the speed comparisons, the increase in speed was not the same for the three collision groups. The results suggest that subjects who fail tend to be more tentative in the VR environment, which perhaps reflects insecurity behind-the-wheel.
The study had two main limitations. In spite of achieving significance in several of the statistical measures, the number of individuals who failed the behind-the-wheel driving test was relatively small. A more extensive program evaluation is planned with a larger number of subjects. Second, the number of challenges in the VR program can be varied. It is possible that challenges that require faster reactions or a greater number of challenges would increase the sensitivity of the VR prediction of performance.
This study is one of the first to identify parameters in a virtual reality environment that may be predictive of behind-the-wheel driving performance in an SCI population. The use of collision events and reduced speed show promise. However, these parameters should be examined carefully in a more comprehensive project that can enroll larger numbers of subjects who actually fail behind-the-wheel evaluations.
REFERENCES
- Keshner, E. A. (2004). Virtual reality and physical rehabilitation: a new toy or a new research and rehabilitation tool? J Neuroeng Rehabil, 1(1), 8.
- Schultheis, M. T., Simone, L. K., Roseman, E., Nead, R., Rebimbas, J., & Mourant, R. (2006). Stopping behavior in a VR driving simulator: A new clinical measure for the assessment of driving. Conf Proc IEEE Eng Med Biol Soc, 1, 4921-4924.
- Schultheis, M. T., Rebimbas, J., Mourant, R., & Millis, S. R. (2007). Examining the usability of a virtual reality driving simulator. Assist Technol, 19(1), 1-8; quiz 9-10.
Acknowledgement.
Funding for this project was provided by The New Jersey Commission on Spinal Cord Research and the Henry H. Kessler Foundation. The original VR Driving simulator was designed and built by Maria Schultheis, PhD and Lisa Simone, PhD.
W. Thomas Edwards, Ph.D.
Rehabilitation Engineering
Kessler Medical Rehabilitation Research and Education Center
1199 Pleasant Valley Way
West Orange, New Jersey 07052, Phone: 973-324-3539