Human Engineering Research Laboratories, Highland Drive VA Medical Center, Pittsburgh PA1
Department of Bioengineering, University of Pittsburgh2
Department of Physical Medicine and Rehabilitation, University of Pittsburgh3
Department of Rehabilitation Science and Technology, University of Pittsburgh4
ABSTRACT
The purpose of this study was to 1) identify steady-state strokes for propulsion on common surfaces, 2) investigate stroke-to-stroke variability and 3) examine the effects that surface and speed have on key biomechanical variables during overground propulsion. Kinetic data were obtained from 25 manual wheelchair users who propelled at target and self-paced speeds on tile, carpet, ramp and dynamometer. Subjects were more irregular in their strokes when asked to maintain a target velocity. Regardless of speed, average velocity and peak resultant force displayed the least and most variability, respectively. Greater stroke-to-stroke consistency was observed on the ramp and dynamometer. The results highlight the importance of conducting propulsion tests over a variety of natural surfaces at self-selected speeds.
KEY WORDS:
manual wheelchair propulsion, biomechanics, steady-state, over-ground
INTRODUCTION
Previous research has shown that at a self-selected pace, biomechanics variables are very repeatable in gait studies (1-4). However, the repeatability of biomechanics variables during wheelchair propulsion has not been studied to the same extent. The repeatability of biomechanics data for wheelchair propulsion on a stationary system, such as a treadmill or dynamometer, has been previously investigated (5). The benefit of using these systems is that they enable the individual to perform a large number of strokes for a given trial and easily reach and maintain steady-state propulsion. The disadvantage of these systems is that they do not perfectly imitate natural overground surfaces and there is concern that they alter the natural stroke pattern of the individual (6). Prior studies suggest that steady-state on overground surfaces is more difficult to achieve and maintain but can be assumed to start after the third stroke (6-7). These studies however did not explicitly examine startup versus steady-state for different types of natural surfaces and for different key biomechanical variables. Therefore, the purpose of this study was to 1) determine the beginning of steady-state strokes for overground propulsion for common surfaces including tile, carpet and ramp and 2) investigate the stroke-to-stroke variability for propulsion over various natural surfaces and compare to propulsion on wheelchair dynamometer. Once steady-state was identified, we aimed to examine differences in key biomechanical variables between floor surfaces and determine the effects of imposing a target propulsion speed on stroke-to-stroke variability.
METHODS
Participants:
Twenty-five manual wheelchair users (23 males, 2 females) participated in this study. The subjects were on average 41 ± 13.6 years old and were 19 ± 11.0 years post-diagnosis. The majority of the subjects had a spinal cord injury (4 cervical, 16 thoracic, 3 lumbar) while one participant had a double below the knee amputation and another had spina bifida.
Data Collection:
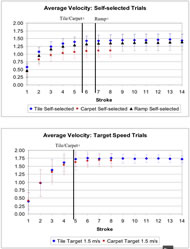
Figure 1. (Click for larger view)
SmartWheels were attached bilaterally to each subject’s wheelchair. Subjects propelled from rest to a casual self-selected pace on level tile, level low-pile carpet and up a tile ramp along a straight-away. The subjects also propelled at a target speed of 1.5 m/s on the level tile and carpet surfaces and at a target speed of 2.0 m/s on the dynamometer. After an acclimation period, data collection on a wheelchair dynamometer began after the subject reached steady-state for both the casual self-selected and target speed conditions. To obtain data for the target speed in the overground trials, subjects followed a power wheelchair preset to the target speed. On the dynamometer, subjects received visual speed feedback on a computer monitor positioned in front of them.
Data Analysis:
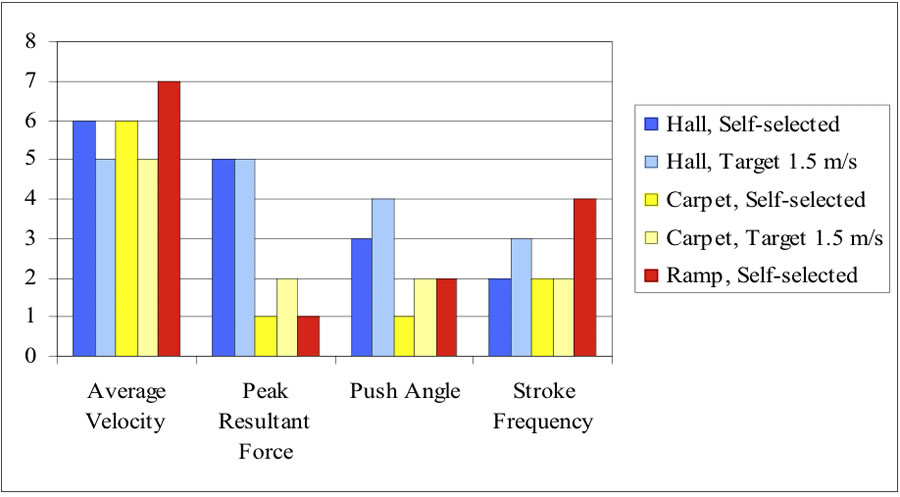
Figure 2. (Click for larger view)
The following variables were calculated from the SmartWheel data for each stroke and analyzed under each floor type and speed condition: average velocity, peak resultant force, push angle and stroke frequency. The statistical software SPSS was used for the analyses. Repeated measures ANOVA with Bonferroni corrected pairwise comparisons were computed for each biomechanics variable to determine whether strokes should be considered start-up or steady-state. A mixed-model test was used to analyze differences in biomechanics between surfaces and speeds using a significance level of 0.05. Coefficient of variation values were determined for each subject and then analyzed across all subjects during steady-state for each trial to compare variability.
RESULTS
Group mean and standard deviation for each stroke are presented for velocity in Figure 1. Velocity was the primary variable considered in determining steady-state because all other biomechanical variables are generally influenced by propulsion velocity. Velocity also gave the most conservative estimate for steady-state. Subjects reached steady-state velocity at stroke 5 during the target speed trials, stroke 6 during self-selected speed trials on the tile and carpet and stroke 7 for the ramp self-selected pace.
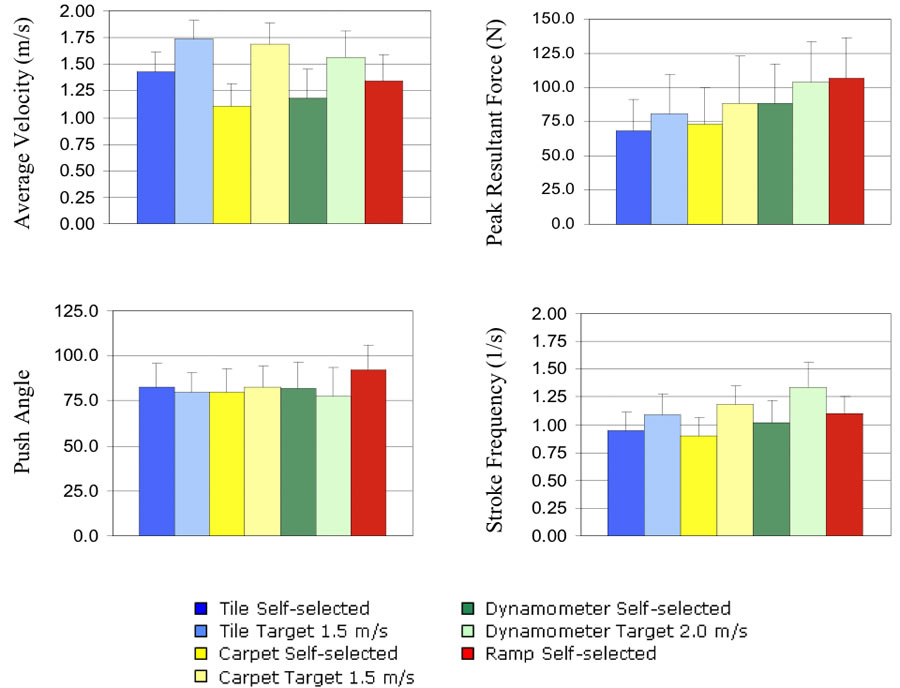
Figure 3. (Click for larger view)
We found that beyond stroke 6 all parameters were at steady-state (Figure 2). Because of space limitations most subjects were only able to obtain 8 strokes on the carpet. Thus we calculated mean values for strokes 6-8 for each parameter (Figure 3). Average velocity and stroke frequency were higher for the target speed trials than the self-selected speed trials (Table1). Peak resultant force was highest on the ramp, followed by dynamometer, carpet and tile. The push angle was largest in the ramp trial, but was statistically similar on all other surfaces.
Biomechanics Variable |
Surface 1 |
Surface 2 |
Mean Difference |
p-value |
Average Velocity (m/s) |
Tile |
Dynamometer |
0.209 |
< 0.001 |
|
Tile |
Carpet |
0.182 |
< 0.001 |
|
Tile |
Ramp |
0.247 |
< 0.001 |
Peak Resultant Force (N) |
Dynamometer |
Tile |
22.259 |
< 0.001 |
|
Dynamometer |
Carpet |
15.810 |
< 0.001 |
|
Ramp |
Tile |
33.554 |
< 0.001 |
|
Ramp |
Carpet |
27.106 |
< 0.001 |
Push Angle |
Ramp |
Dynamometer |
12.353 |
< 0.001 |
|
Ramp |
Tile |
11.260 |
< 0.001 |
|
Ramp |
Carpet |
10.663 |
< 0.001 |
Stroke Frequency |
Dynamometer |
Tile |
0.160 |
< 0.001 |
|
Dynamometer |
Carpet |
0.140 |
< 0.001 |
|
Dynamometer |
Ramp |
0.083 |
0.042 |
Surface had a significant effect on all variables and speed had a significant effect on all variables except push angle. The coefficient of variation values for strokes 6-8 are shown in Table 2. These strokes represent the steady-state for all variables, speeds and surfaces. Overall, average velocity displayed the least variability ranging from 2.32-3.03% and peak resultant force was found to have the most variability ranging 7.62-20.87%.
DISCUSSION
Steady-State Analysis:
Although we found that strokes do not become statistically similar until strokes 5 or 6 the greatest difference between the first stroke of steady-state and the previous stroke on any surface was only 0.09 m/s. Therefore this study is consistent with others who have found that steady-state on overground surfaces begins with stroke 4 (6-7).
Effect of Surface:
Because of a large decrease in velocity after each stroke on the ramp, steady-state propulsion on this surface more closely resembled start-up propulsion. Subjects reached a steady force much earlier on the carpet and ramp surfaces compared to tile. Once subjects reached a constant velocity on tile they reduced the applied force, but because of the resistances on the carpet and ramp, the force applied at start-up was maintained throughout the trial. The push angle became constant earlier than the average velocity or peak resultant force on all overground surfaces. Therefore, when the subjects were required to push against more resistance or at a faster speed, they did not change the angle of their push except during the ramp trial when subjects propelled with a larger angle. Subjects on the ramp pushed at a velocity comparable to self-selected velocity on tile and so they may have been using the larger angle to achieve this pace.
Effect of Speed:
Subjects chose a slower velocity, applied less force and selected a lower stroke frequency when propelling at a comfortable selected pace compared to the target speed condition. In other words, they were required to apply a greater, more frequent force to achieve and maintain the target velocity, which is consistent with previous studies (8).
Stroke-to-Stroke Variability:
There was more variability in all variables during the target velocity trials than during the self-selected pace trials, which suggests that subjects were more irregular in their strokes when maintaining a target velocity. This may be due to subjects having to propel faster than their comfortable self-selected velocity or the need to adjust their stroke technique more often to keep pace with the power wheelchair. In order to maintain a consistent velocity on tile and carpet, subjects varied their stroke-to-stroke force application to a large extent and stroke frequency and push angle to a lesser extent. This was not the case for the dynamometer and ramp, which both had lower variability than the other surfaces and similar variability across variables. Both the ramp and dynamometer impose different types of constraints on propulsion which may limit stroke-to-stroke variability. The ramp requires nearly constant contact with the wheel to move forward and to avoid rolling backwards leaving little room for alterations in force application and hand positioning. Because the wheelchair is secured to rollers on the dynamometer, the natural stroke-to-stroke adjustments that would be otherwise needed to maintain stability of the wheelchair and keep the wheelchair moving in a ‘straight line’ are not needed.
CONCLUSION
While average velocity is not statistically consistent until strokes 5 or 6, other variables are at steady-state at stroke 4 and the magnitude of difference in velocity between strokes 4 and greater is negligent. This study underscores the importance of testing individuals over a variety of real surfaces because different strategies are used in each case to maintain a desired velocity. It is also important to collect trials of individuals propelling at their own paces to obtain the most natural strokes for analyses. Future work should involve determining the number of trials and strokes necessary for achieving greater reliability and comparing differences in subject characteristics to determine whether this factor may explain some of the variability in the data.
REFERENCES
- Jordan K, Challis JH, Newell KM. Speed influences on the scaling behavior of gait cycle fluctuations during treadmill running. Human Movement Science. 26(1), 2007, 87-102.
- Kadaba MP, Ramakrishnan HK, Wootten ME, Gainey J, Gorton G, Cochran GVB. Repeatability of kinematics, kinetic, and electromyographic data in normal adult gait. Journal of Orthopaedic Research. 7, 1989, 849-860.
- Monaghan K, Delahunt E, Caufield B. Increasing the number of gait trial recordings maximizes intra-rater reliability of the CODA motion analysis system. Gait and Posture. 25, 2007, 303-315.
- Yavuzer G, Oken O, Ergocen S, Stam HJ. Repeatability of lower limb three-dimensional kinematics in patients with stroke. Gait and Posture. 27(1), 2008, 31-5.
- Richter WM, Rodriguez R, Woods KR, AXelson PW. Stroke pattern and handrim biomechanics for level and uphill wheelchair propulsion at self-selected speeds. Archives of Physical Medicine and Rehabilitation. 88, 2007, 81-7.
- Koontz AM, Cooper RA, Boninger ML, Yang Y, Impink BG, van der Woude L. A kinetic analysis of manual wheelchair propulsion during start-up on select indoor and outdoor surfaces. Journal of Rehabilitation Research and Development. 42(4), 2005, 447-458.
- Cowan RE, Boninger ML, Sawatzky BJ, Mazoyer BD, Cooper RA. Preliminary outcomes of the SmartWheel Users’ Group database: A proposed framework for clinicians to objectively evaluate manual wheelchair propulsion. Archives of Physical Medicine and Rehabilitation. 89, 2008, 260-8.
- Collinger JL, Boninger ML, Koontz AM, Price R, Sisto SA, Tolerico ML, Cooper RA. Shoulder biomechanics during the push phase of wheelchair propulsion: A multisite study of persons with paraplegia. Archives of Physical Medicine and Rehabilitation. 89, 2008, 667-676.
ACKNOWLEDGEMENTS
The funding for this research was provided in part by the National Science Foundation, Project EEC 0552351, using data from the National Institute of Health Grant Number 1 R03 HD049735-01A1, Wheelchair Propulsion Training.
Human Engineering Research Laboratories, 7180 Highland Dr., 151R1-H, Pittsburgh, PA 15206 Email: eat18@pitt.edu