ABSTRACT
Many people with visual impairments do not read Braille and have problems interpreting tactile information [1]. Some of them have enough residual vision so that if streets and their names were presented in the proper color, size, and style, they could benefit from customizable large print maps. Such maps would allow people with low vision to study a new area, pre-plan travel, and have portable maps to consult while navigating in unfamiliar areas. This paper presents an algorithm for placing street names on street maps produced by the Tactile Map Automated Production (TMAP) software in the Scalable Vector Graphics (SVG) format.
KEYWORDS
low vision, map labeling, SVG
BACKGROUND
The Tactile Map Automated Production (TMAP) is a project at Smith-Kettlewell Eye Research Institute whose objective is to provide blind users with access to customizable tactile representations of various geographic areas [2]. TMAP has demonstrated the feasibility of producing tactile maps with embedded audio descriptions accessible through the Talking Tactile Tablet (TTT) from Touch Graphics, Inc [3]. TMAP-generated maps use the data from the US Census Bureau's Topologically Integrated Geographic Encoding and Referencing System (TIGER®). The TIGER® data files contain the names and locations of virtually all the streets in the U.S. stored as latitude and longitude point vectors. TMAP also has the capability to automatically convert them into the Scalable Vector Graphics (SVG) files that contain the 2D coordinates of each street block, street names, street block directions, and address ranges on both sides of street blocks.
Websites, such as MapQuest, Yahoo! Maps, MSN Maps, and Google Maps offer a wide range of options for viewing and printing maps. However, these maps often have too much detail, use very small fonts, and use colors that are not perceivable to those with low vision. In a previous study [4], the we identified several problems that these maps present for low vision people: 1) small street names (user may want to enlarge font size); 2) streets in two different colors (user may want them to be the same color or in alternating colors or shades); 3) pastel colors hard to see; 4) grey colors to show building footprints too light to see (user may want to eliminate this feature or make it more prominent); 5) more detail than needed or that would be accessible (e.g., instead of displaying all subway stops and the lines they are on the user might want to highlight only those stops that suit a particular rout); 6) building names displayed in light grey fonts.
To motivate our current study, the second author collected some pilot data from a group of 16 low vision individuals (vision acuity ranging from 20/125 to 20/1260). The age range was from 27 to 75 with the average age being 47.8. Fifteen said that they never used regular standard print maps. When asked how many years it had been since they used an ordinary regular size map, the average answer was 12.6 years. The collected pilot data suggested that the participants preferred large font sizes, simpler color arrangements, and smaller amounts of information displayed on the map, and were very enthusiastic about being able to customize these features.
The pilot data informed the initial design of our system. In order to produce a customized legible map, the user must be able to interact with the map data. An automated system that produces maps for low vision individuals should allow the user to customize line width, font style, font size, legend, and labeling style all with a choice of background and foreground colors. The user should have a choice of street labels. If there is little clutter, the street names can be placed next to the streets like on regular visual maps. If clutter is pronounced, name abbreviations can be computed and additional pages generated with all abbreviations and full names in some order. Users should have the option to change the settings if the resulting map is not legible. This type of system, which we call the Large Print Map Automated Production System (LPMAPS), will enable people with various eye disorders to view on-screen, customize, and print maps at a scale that best suits their individual needs.
In this paper, we present a map labeling algorithm for placing street names on SVG street maps. The algorithm is a key component of the LPMAPS. Many map labeling problems are known to be NP-hard [5]. Thus, to be efficient, all solutions must necessarily use heuristics.
METHOD
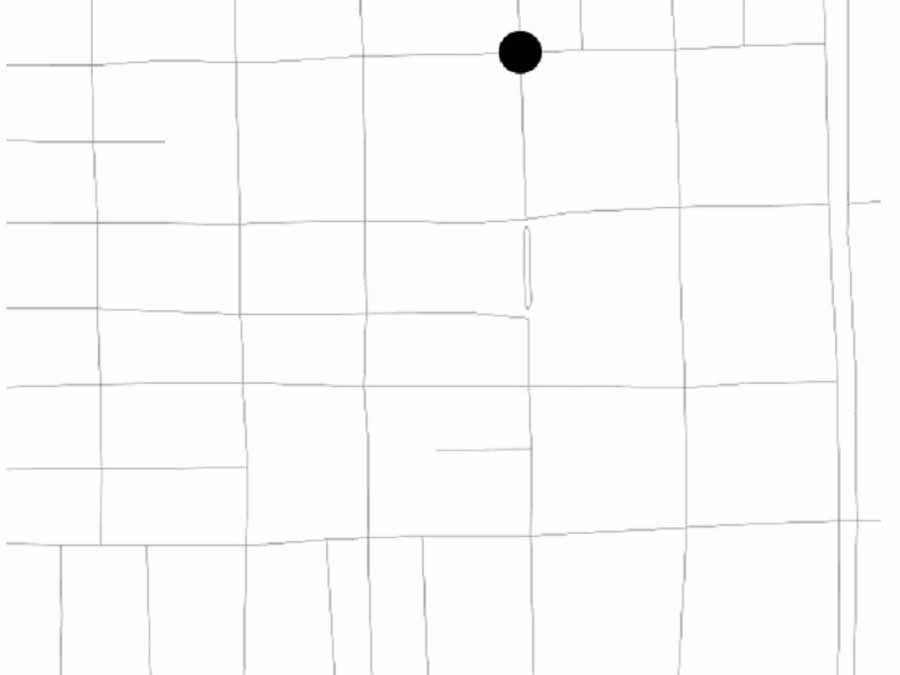 Figure 1: Part of the TMAP-generated input SVG file
Our method allows the user to specify font size, font style, font color, line width, and line color which are saved in an XML configuration file. The algorithm takes as input the XML configuration file and a user-selected TMAP-generated SVG file that consists of streets with no displayed street names (See Fig. 1). A street is an SVG group of street segments (blocks). A segment is a polyline that consists of two 2D points: the start point and the end point. In the actual text of the TMAP-generated file, street names are associated with each segment as SVG attributes. When the algorithm processes the segments of a street, it checks if pairs of street segments can be aggregated into larger street segments. These larger street segments are called aggregated segments. The segments are aggregated when the change in their slopes does not exceed a threshold of ten degrees. After the segment aggregation has been computed on its edges, a street is called an aggregated street. A street with n segments, once aggregated, can have at least one segment (when all segments are aggregated into one) and at most n segments (when no segments can be aggregated, e.g., the segments have a pronounced see-saw pattern). When they can be aggregated, two segments S1 and S2 are aggregated into one straight line segment: the aggregated segment starts at the starting point of S1 and ends at the end point of S2. Thus, each segment of an aggregated street is a straight line segment.
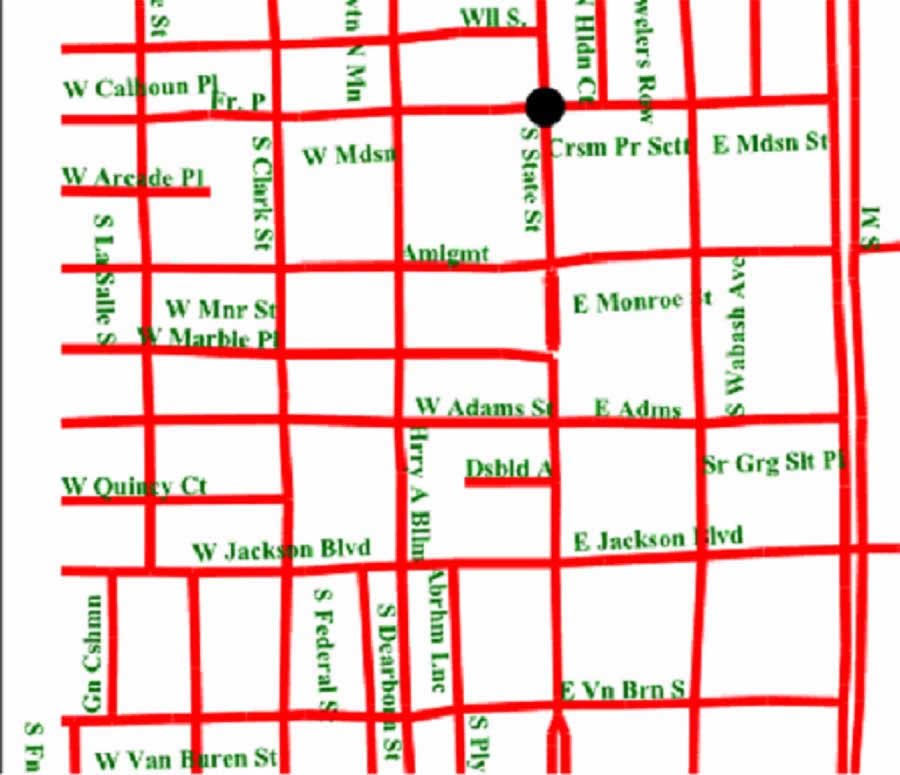 Figure 2: The output SVG file produced by the map labeling algorithm
A street label, label henceforth, is a text string that spells out a street name. A label region is a 2D rectangle inside of which a specific label can be placed. Each segment of an aggregated street is allowed to have exactly two label regions associated with it: one above and one below, which means that the algorithm currently can place a label either above or below a segment. If a label region is smaller than the label, the label is iteratively reduced: "Drive" becomes "Dr"; "Way" becomes "Wy"; "the" is removed; all vowels are removed; the label's last character is removed. The last change is applied only after the previous reductions have been tried.
If a label region is larger than its label, there are multiple positions inside the region where the label can be placed. These candidate positions are computed by shifting the label along the bottom line of the region by the width of the character 'A' in the user-selected font and font size. The first position starts at the left vertical line of the region. The next position is obtained by shifting the previous position along the bottom line of the region by the width of the character 'A' until the shifted label goes outside of the right vertical line of the region.
 Figure 3: Part of the output SVG map of Time Square.
A bounding rectangle is computed for each candidate label position using the font's ascent and descent. Each bounding rectangle is assigned a real score and the rectangle with the largest score is finally selected as the place where the label is placed. The initial score of a candidate position is the area of its bounding rectangle. The score is iteratively modified by subtracting from it the areas of its intersections with other labels and street segments. The candidate label position with the highest score is chosen. Once every street has been labeled by placing its label next to one of its aggregated segments, the entire algorithm can be re-run on the new map. The output of the algorithm for the map in Fig. 1 is given in Fig. 2. Fig. 3 contains another sample output map computed by our algorithm. It should be noted that some user-specified configurations cannot result in an acceptable label placement. For example, if the user selects a very large font size, it is not physically possible to place all labels on the map.
RESULTS
The algorithm is currently implemented in Java in the NetBeans 6.5 IDE and, when executed on a Dell Optiplex GX620 PC, takes approximately 2-3 seconds to produce a complete SVG map with labeled streets from a TMAP-generated SVG file.
DISCUSSION
We presented a map labeling algorithm for placing street names on SVG street maps. The algorithm is a key component of the Large Print Map Automated Production System that we are currently researching and developing. Since many map labeling problems are known to be NP-hard, our algorithm does not try to find an optimal placement by solving the problem exhaustively. Instead, it uses several heuristics to find an acceptable solution.
REFERENCES
- Nicholson, J., Kulyukin, V., and Marston, J. (2009). Building Route-Based Maps for the Visually Impaired from Natural Language Route Descriptions. Proceedings of the 24th International Cartographic Conference (ICC 2009), Santiago, Chile, November 2009, Avail. on CD-ROM.
- Miele, J. A., & Marston, J. R. (2005). Tactile Map Automated Production (TMAP): On-Demand Accessible Street Maps for Blind and Visually Impaired Travelers. Proceedings of the American Association of Geographers 101st Annual Meeting, Denver, CO.
- Miele, J. A., Landau, S., and Gilden, D. B. (2006). Talking TMAP: Automated Generation of Audio-Tactile Maps Using Smith-Kettlewell’s TMAP Software. The British journal of Visual Impairment, 24(2), 93-100.
- Marston, J. R., Miele, J. A., & Smith, E. L. (2007). Large Print Map Automated Production (LPMAP). Proceedings of the 23rd International Cartographic Conference, Moscow, Russia.
- Claudia Iturriaga and Anna Lubiw. (1997). NP-hardness of some map labeling problems. Technical Report CS-97-18, University of Waterloo, Canada.
ACKNOWLEDGMENTS
The first author would like to acknowledge that this study was funded, in part, by NSF Grant IIS-0346880.
Author Contact Information:
Vladimir Kulyukin, Computer Science Assistive Technology Laboratory, Department of Computer Science, Utah State University, 4205 Old Main Hill, Logan, UT 84322-4205, Office Phone (435) 797-8163. EMAIL: vladimir.kulyukin@usu.edu.
Word Version PDF Version