Mobility Metrics for Manual Wheelchair Use in Everyday Life
Rehabilitation Engineering and Applied Research Laboratory, Georgia Institute of Technology
Atlanta, GA 30332
ABSTRACT
In this study, a method for the robust detection of manual wheelchair movement with accelerometer-based data logging is used to obtain metrics of wheelchair mobility that complement mean- and total-distance-only based measurements. It is found that these metrics, that include distance, time and number of activity bouts, provide better understanding of everyday use of manual wheelchairs by shedding more light into how users operate their wheelchairs in their daily lives.
KEYWORDS
Wheelchair; mobility ; rehabilitation; activities of daily living.
BACKGROUND
In general literature on wheelchair usage is limited and mean distance is the main quantity of interest that is reported(1,2). A description of wheelchair use in everyday activities that looks beyond total and mean wheeled distances has been recently proposed and shown appropriate for power wheelchair users(3). In (3), the need for a more thorough measure of power wheelchair use in the community was established and focused on three metrics: distance, time and number of bouts of activity. A bout of activity is defined as a measure of mobility that includes travel between intentional activities, as opposed to a bout of movement, which includes any possible wheelchair movement, be it activity-oriented or not. Together, these metrics can provide information about power wheelchair usage characteristics that can impact the design, policy and prescription of these devices and that cannot otherwise be captured accurately by distance-only based metrics. Therefore, this study aims to examine the application of these additional metrics to manual wheelchairs, and assess their appropriateness to the manual wheelchair scenario, especially when compared with more traditional total distance and duration measures.
METHOD
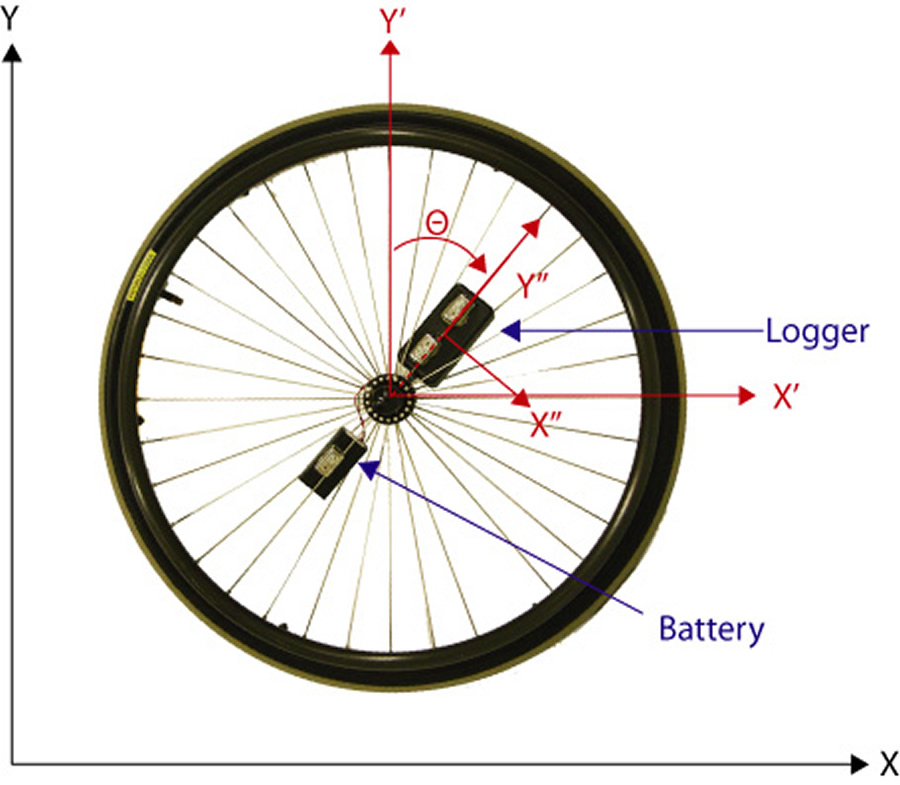 Figure 1.
Acceleration logger mounted on a manual wheelchair wheel. Two of the measuring axes (X’ and Y’) are parallel to the wheel plane (X and Y). Only these two axes are analyzed, while acceleration along the third axis, perpendicular to the wheel plane, is not used.
A convenience sample of 12 adults, ages 23 to 68 (median 39.5), with some affiliation to the local spinal cord injury (SCI) rehabilitation center who used manual wheelchairs as their primary mobility devices were recruited for this study with IRB approval. Subjects signed informed consent forms prior to beginning their participation in the study. Each of the participant’s wheelchairs was instrumented with a solid-state, triaxial, MEMS-based acceleration logger with a ±2g range, at a sampling rate of 10Hz. This logger was mounted on one of the wheels –as seen in Figure 1– for periods between 1 to 2 weeks (depending on subject availability). This method of measuring manual wheelchair movement has been described previously(4) and offers a rate of accuracy better than 90% across manual wheelchair models and indoor and outdoor surfaces.
Only the two components of acceleration coplanar with the wheel were analyzed (X and Y components as seen in Figure 1). The collected acceleration data was processed by the method in (4) to produce detailed information about bouts of movement, i.e., detect when the wheelchair was moving, and further processed to identify bouts of activity. The criteria for considering a movement bout a “bout of activity” include a minimum stop time of 15 seconds and a start time of at least 5 seconds. These thresholds were determined empirically as described in previous work (3).
Once bouts of activity were identified, statistics about their duration, distance and speed were also gathered, including mean, standard deviation, range and median. These were later aggregated to generate median and range day information. Total duration and distance wheeled were also computed in order to correlate them with the median, range and number of bouts of activity figures.
RESULTS
Median and Range Distribution of Mobility Measures |
|||
Subject |
Distance |
Bouts of activity |
Time spent wheeling |
11 |
614 (298-1281) |
42 (25.00-71) |
22 (13-39) |
3 |
1171 (1134-1208) |
124 (113-134) |
56 (56-57) |
1 |
1263 (680-2656) |
81 (63-92) |
41 (30-55) |
5 |
1422 (506-4333) |
55 (39-130) |
36 (17-101) |
8 |
1641 (1192-2213) |
102 (86-133) |
60 (42-64) |
12 |
1675 (630-3497) |
115 (52.00-223) |
60 (25-130) |
6 |
1861 (1353-2827) |
99 (68-131) |
54 (42-71) |
4 |
2094 (1852-3312) |
110 (94-135) |
71 (61-81) |
9 |
2119 (1572-5938) |
149 (135.00-208) |
79 (70-177) |
2 |
2149 (1628-2944) |
111 (90-152) |
65 (56-97) |
10 |
2512 (2048-3184) |
171 (139.00-260) |
98 (79-114) |
7 |
3131 (79-4949) |
75 (12-133) |
79 (4.4-128) |
Table 1 shows a list of median and range day mobility parameters for our subject population, sorted by ascending wheeled distance. Two important observations can be made. First, an increase in distance does not imply an increase in the number of activity bouts. Although not showed explicitly in Table 2, the same disparity can be seen between wheeling time and activity bouts. Second, the ranges of variation are very wide for all parameters. Therefore, the day-to-day spread in these parameters within subjects is large.
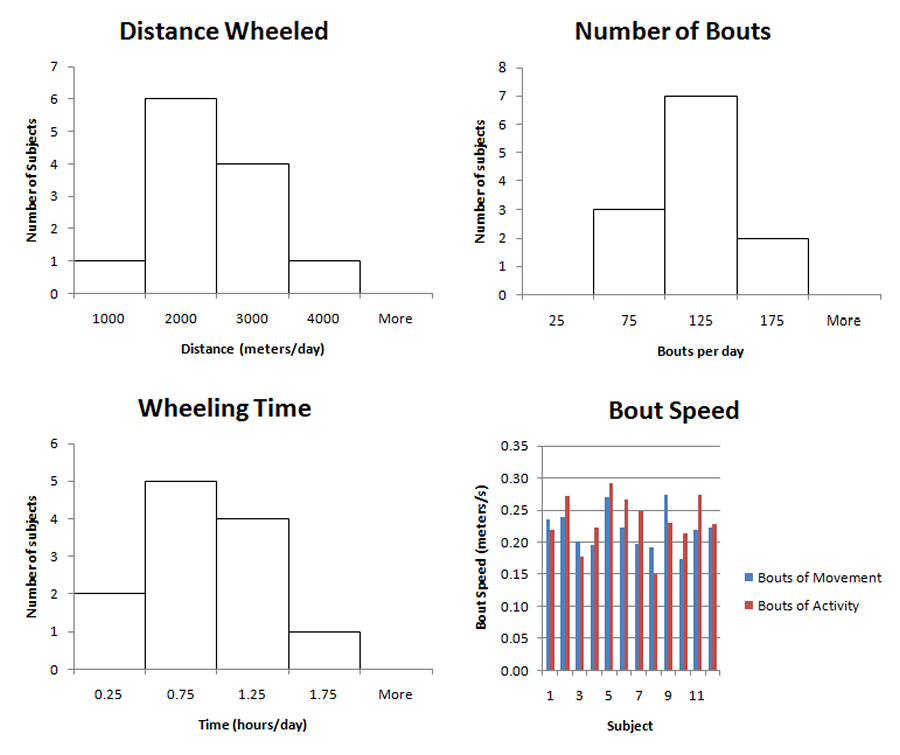
This figure depicts the statistical distribution –based on median day quantities– of the total distance wheeled, number of bouts and wheeling time for 12 manual wheelchair subjects. An additional plot compares the speed of bouts of activity and bouts of movement per subject based on median figures.
Median day statistics have been compiled and are shown in Figure 2 as histograms. Of importance is the examination of the total distance wheeled. As seen in the top left corner of Figure 2, this distribution is skewed towards zero, though to a lesser degree than in the case of power wheelchairs (4). Regardless, a mean distance figure alone would not be representative of typical behavior for our subject population. This confirms the need for additional metrics.
The top right corner of Figure 2 shows a histogram of number of activity bouts. This is the distribution that is closer to a normal distribution of all the ones examined in this study. This is different than in the power wheelchair case (3), where the number of bouts is skewed towards zero. What this means is that in our subject population tends to engage in more bouts of activity daily than their power wheelchair counterparts. The fact that the mean (n=103) and the median (n=106) are close, make the number of bouts an attractive indicator for mobility in manual wheelchairs.
The bottom left section of Figure 2 shows the distribution of total wheeling time across participants. Again, this histogram is skewed towards zero, resembling the trend observed with power wheelchairs in (3). Analogously, it can be concluded that wheeling time alone is not a good indicator of wheelchair activity, as it clearly doesn’t correlate with the number of bouts distribution.
Having looked into distance and bouts, it seems appropriate to examine speeds. The research question is if the speed of a bout depends on the purpose of such bout. Are bouts of activity, overall, faster or slower than simple bouts of movement? The “Bout Speed” plot in Figure 2 shows that the speeds for bouts of activity and bouts of movement are generally close, within 20% of one another. However, there were two cases of subjects in which the difference was 21% and 28%. This finding makes it necessary to carry further studies that look into demographic factors.
DISCUSSION
As reflected by the wide ranges in number of bouts, distances and durations of wheeling, it is clear that there is no single typical behavior of full-time manual wheelchair use. Therefore, the conclusion that distance or time alone are insufficient to describe mobility for power wheelchair users(3) can now be extended to manual wheelchair users, as evidenced by the poor correlation between wheeled distance or total time spent wheeling to number of bouts as seen in Figure 2. An interesting observation was the relative normality of the number of activity bouts distribution, but this finding will have to be verified in a larger population before embracing it as the dominant mobility measure. Future work should also study the need for combining some of these additional metrics in order to enable clinicians, manufacturers and policymakers to make more informed decisions –that take into account actual wheelchair usage– regarding the design and prescription of manual wheelchairs. Even though we believe that the metrics presented in this study apply to manual wheelchairs based on our measurements, further work is needed to research possible deeper correlations to demographic factors. Also, possible differences between indoor and outdoor manual wheelchair activity need to be studied in light of these additional measures of mobility.
REFERENCES
- Cooper R.A., Thorman T., Cooper R., et al., “Driving characteristics of electric-powered wheelchair users: how far, fast, and often do people drive?,” Arch Phys Med Rehabil 2002;83:250-5.
- Fitzgerald SG, Arva J, Cooper RA, Dvorznak MJ, Spaeth DM, Boninger ML. “A pilot study on community usage of a push-rim activated, power-assisted wheelchair. Assist Technol 2003;15:113-9.
- Sonenblum, S.E., Sprigle, S., Harris, F.H., Maurer, C.L., “Characterization of Power Wheelchair Use in the Home and Community,” Archives of Physical Medicine and Rehabilitation 89(3), 486-91, 2008.
- Sonenblum, S.E., Caspall, J., et al, “An Analysis Method for Detecting Manual Wheelchair Movement.” Presented at the BMES Annual Meeting. 2009. Pittsburgh, PA.
ACKNOWLEDGMENTS
Funding was provided by NIDRR through the RERC on Wheeled Mobility (H133E080003). The opinions contained in this article do not necessarily reflect those of the U.S. Department of Education.
Author Contact Information:
Ricardo Lopez, MS, 325945 Gatech Station, Atlanta, GA 30332, Office Phone (404) 385-0641, EMAIL: ricardo.lopez@gatech.edu