Lata Grover1, Amaya Arcelus1, Rosalie Wang2, Rajibul Huq1, Karl Zabjek1, Debbie Hebert2, Alex Mihailidis1,2
1University of Toronto, 2Toronto Rehabilitation Institute
ABSTRACT
With high annual stroke incidence rates and stroke being a leading cause of disability, technologies are being built to assist post-stroke recovery. An upper limb rehabilitation robot with artificial intelligence (AI) is being developed. To improve device safety, it should incorporate accurate user fatigue detection. This study investigated electromyography (EMG) fatigue patterns while using the robot to correlate with robot-collected data. Healthy participants were recruited and instructed to use the robot over a 30-minute period. An index, sensitive to low resistance dynamic exercises, was used to evaluate frequency changes of EMG signals. Healthy participants had, on average, local fatigue in 5.50 (±0.89, 95% CI) of the seven measured muscles after 30 minutes. EMG data was able to detect fatigue due to the robot exercise. The data will be correlated with robot-collected parameters to build an AI model that adapts to users’ perceived fatigue and change the exercise type accordingly.
BACKGROUND
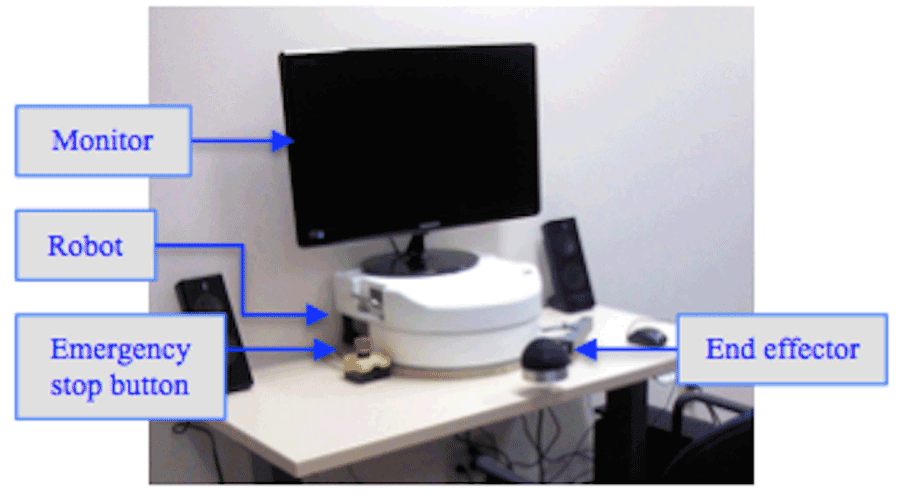 Figure 1: Image of the upper limb rehabilitation robot with a monitor to display a Graphical User Interface
Annual stroke incidence is approximately 795,000 in the United States (Roger et al., 2011) and 50,000 in Canada (Public Healthy Agency of Canada, 2009), and stroke has become a leading cause for disability (Public Health Agency of Canada, 2009). Stroke survivors benefit from physiotherapy and occupational therapy to rehabilitate their upper extremities (Oujamaa, Relave, Froger, Mottet, & Pelissier, 2009). The Intelligent Assistive Technology & Systems Lab (IATSL) at the Toronto Rehabilitation Institute and one of their commercial partners, Quanser Inc., have developed a low cost, portable upper limb rehabilitation robotic device (Figure 1) to maximize the time patients are able to spend performing repetitive therapy tasks (Lu et al., 2011). The device incorporates artificial intelligence (AI) that will autonomously vary exercises and change resistance and assistance levels according to the user’s performance. Kan, Huq, Hoey, Goetschalckx, and Mihailidis (2011) present the AI description and discuss its needs and benefits in more detail.
To be effective, the AI should accurately understand the user’s performance. Therefore, if the user has reached a high fatigued state, the AI should realize the patient is in this state and decrease resistance and/or increase assistance levels or stop the exercise to prevent user harm. Additionally, if the user has very low fatigue levels, resistance levels should be increased. Post-stroke patients have been observed to be easily fatigable during therapy, and fatigue detection has been identified as a key design requirement (Lu et al., 2011). The AI currently estimates user’s fatigue using their speed and accuracy performance. The estimated fatigue has to now be validated using biofeedback that indicates physiological fatigue. To the knowledge of the authors, there is limited work that has focused on upper extremity fatigue during dynamic post-stroke therapy tasks.
Fatigue is commonly measured by electromyography (EMG) signals (Larivière, Arsenault, Gravel, Gagnon, & Loisel, 2002; Dimitrova, Arabadzhiev, Hogrel, & Dimitrov, 2009). A reduction in frequency combined with an increase of amplitude of EMG signals is an indicator of localized fatigue in isometric exercises (Dimitrova & Dimitrov, 2003; Merletti, Knaflitz, & Luca, 1990; Søggard, Blangsted, Jørgensen, Madeleine, & Søggard, 2003). Dimitrov et al. (2006) suggest a novel index, FI![]() nsmk, for analyzing the frequency of dynamic exercises, seen in Equation 1, where ƒ
nsmk, for analyzing the frequency of dynamic exercises, seen in Equation 1, where ƒ![]() is frequency, P( ƒ
is frequency, P( ƒ![]() ) is the spectral power at frequency ƒ
) is the spectral power at frequency ƒ![]() , and κ
, and κ![]() is the spectral moment order.
is the spectral moment order.
 (1)
(1)
This calculation emphasizes lower frequencies and underemphasizes higher frequencies of a signal. This is ideal for the robot’s dynamic, low resistance level exercises, as the magnitude of frequency decreases will most likely be smaller than in isometric, high resistance level exercises. Dimitrov et al. experimented with k = 1…5, and found that k = 5 shows the greatest changes in the index values. González-Izal et al. (2010) validated using the “Dimitrov” index for the analysis of dynamic leg exercises.
PURPOSE
The purpose of this study is to determine fatigue generation trends while using the upper limb rehabilitation robotic device based on the Dimitrov index of EMG signals. The preliminary results presented in this paper focus on the fatigue levels experienced by healthy participants. This data will be used to further develop the robot’s AI model.
METHODS
Equipment
The study used the Trigno Wireless EMG system (Delsys Inc., Boston, MA) with an incorporated accelerometer. EMG data was collected at 2000 Hz and accelerometer data at 148 Hz. Participants used a Numerical Rating Scale (NRS) to rate their perceived fatigue level from a scale of one to ten.
Procedure
Twelve healthy participants (5 males, 7 females) were recruited to use the robot while being monitored by EMG electrodes. The average participant age was 28.4 (±3.8, 95% CI) years. All participants were able to perform 30 minutes of upper limb movement in five-minute intervals. Participants were given random identification numbers from two to 13. Identification number one was used for trial testing.
Baseline information was first collected and included three sets of isometric maximum voluntary contractions (MVC) of seven different upper limb muscles and a fatigue NRS. The seven muscles were the flexor capri radialis (FF), extensor capri radialis longus (FE), biceps brachii (B), triceps brachii (T), anterior deltoid (AD), medial deltoid (MD), and posterior deltoid (PD) of the dominant arm. Electrode placement sites were determined by recommendations from the Surface ElectroMyoGraphy for the Non-Invasive Assessment of Muscles (SENIAM) group (SENIAM, n.d.). MVC instructions were followed from the Handbook of Manual Muscle Testing (Cutter & Kevorkian, 1999). Each MVC was held for five seconds.
After baseline information was collected, a 30-minute break was provided. Participants then performed six five-minute intervals of a robot exercise, separated by one-minute break periods. The exercise involved reaching forward (elbow extension) and then back (elbow flexion) in the sagittal plane with the dominant arm in a two-waypoint exercise against a fixed resistance level. The fixed resistance level was randomly chosen for each participant between 0, 15, 30 and 40 N. Participants’ EMG data were collected during the exercise intervals. During the one-minute breaks, participants answered the fatigue NRS. After the robot exercises, the same baseline MVCs and fatigue NRS were collected.
Analysis
Data analysis was performed in MATLAB R2012b. Means of all EMG and accelerometer signals were first subtracted from their respective signals.
The smoothed accelerometer data were used to determine when the participant was in an elbow flexion or extension phase. Smoothing window sizes were determined for each participant, based on their speed. These starting and ending points of flexion and extension phases were used to separate the analysis for the EMG data. The Dimitrov index with k = 5 was calculated at a 10 Hz frequency and separated by whether the participant started the ten samples in a flexion or extension phase.
Each Dimitrov index calculation was divided by the Dimitrov index for its muscle’s MVC to enable the observation of fatigue over time. Of the three initial MVC trials for each muscle, the trial that generated the lowest Dimitrov indicator was used for this calculation, as it represented the least fatigued state.
EMG data could not be processed due to noise for participant two’s sixth interval and participant four’s third and fourth intervals.
RESULTS
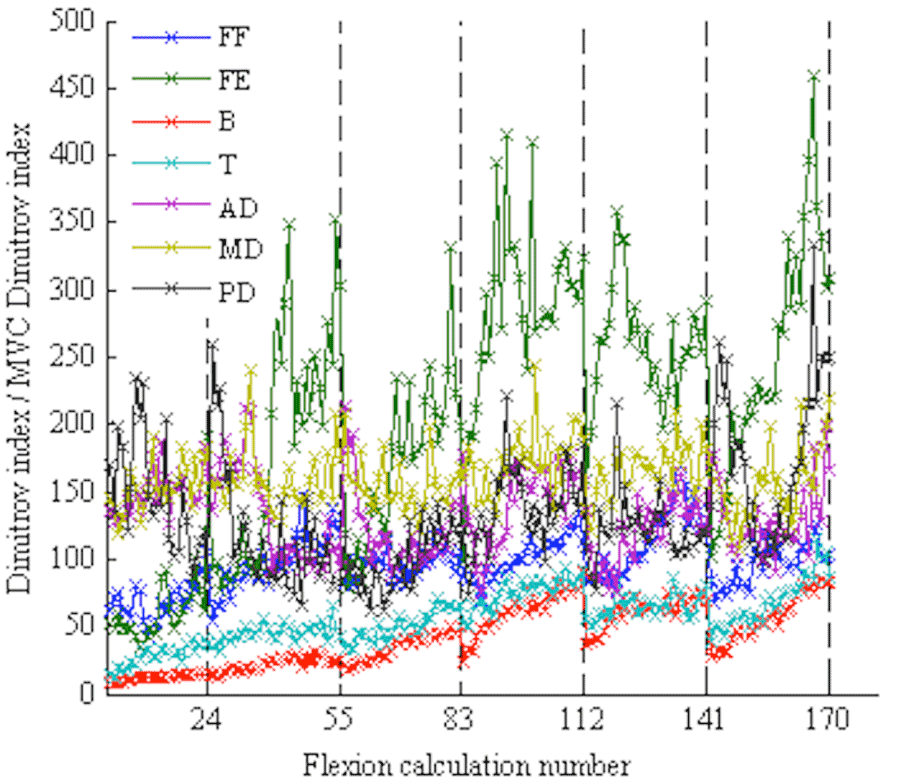 Figure 2: Participant nine’s Dimitrov indices for the flexion phases divided by the MVC Dimitrov index for each respective muscle. The x-axis gridlines show the separation of five-minute intervals. Each flexion calculation number represents 50 average Dimitrov indices.
Figure 2 depicts an example of participant nine’s Dimitrov indices for the flexion phases divided by the MVC Dimitrov index, with the average of every 50 calculations shown. The six five-minute intervals are shown to be continuous in the figure. When the ratio value increases, it indicates that the EMG signal frequencies are decreasing, and there is localized muscle fatigue.
The Dimitrov indices calculated at a 10 Hz frequency were averaged for each interval (DIc where c = 1…6) for each muscle. DI6/DI1 results are shown in Table 1 to show the final fatigued states of participants. If DI6/DI1 is greater than one, the participant is at a more localized fatigued state in his/her last interval than his/her first for that muscle. For participant two, DI5/DI1 is shown because of the unavailability of interval six data. Table 1 also shows the change of the fatigue NRS from before interval one to after interval six.
Participant |
Change of Fatigue NRS |
FF |
FE |
B |
T |
AD |
MD |
PD |
2 (DI5/DI1) |
7 |
1.57 |
1.54 |
1.79 |
1.82 |
1.50 |
1.26 |
1.07 |
3 |
0 |
0.42 |
0.91 |
1.46 |
1.16 |
0.97 |
0.99 |
0.68 |
4 |
3 |
0.85 |
2.23 |
0.92 |
6.98 |
2.16 |
1.96 |
2.47 |
5 |
7 |
0.96 |
1.57 |
1.44 |
1.19 |
1.63 |
1.48 |
1.22 |
6 |
5 |
0.95 |
2.55 |
2.13 |
1.51 |
1.30 |
1.25 |
1.16 |
7 |
4 |
1.02 |
1.23 |
2.72 |
2.34 |
3.39 |
23.78 |
1.55 |
8 |
3 |
1.57 |
1.12 |
1.56 |
1.82 |
1.00 |
1.27 |
1.39 |
9 |
8 |
1.07 |
2.13 |
3.55 |
3.11 |
1.51 |
1.45 |
1.15 |
10 |
6 |
0.79 |
1.35 |
2.47 |
2.09 |
1.17 |
1.74 |
0.82 |
11 |
-1 |
10.79 |
1.95 |
2.78 |
2.01 |
0.13 |
1.78 |
2.24 |
12 |
2 |
0.99 |
1.30 |
1.78 |
1.32 |
1.30 |
0.89 |
0.92 |
13 |
4 |
0.74 |
1.51 |
1.39 |
2.10 |
0.66 |
1.40 |
0.73 |
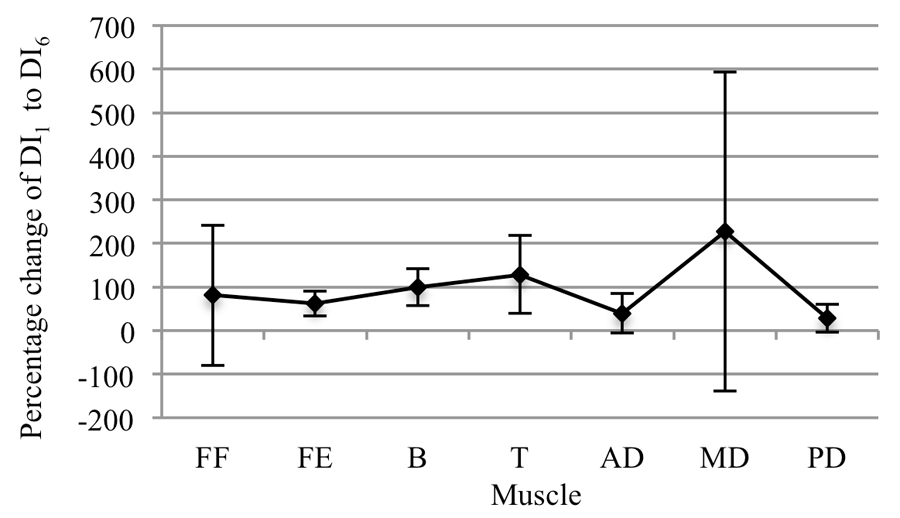 Figure 3: Percentage change of the average Dimitrov index from the first to sixth interval for each muscle and all participants combined, with the 95 percent confidence intervals shown
An average of 5.50 (±0.89, 95% CI) of the seven measured muscles are locally fatigued for all participants by the sixth interval. The magnitude of the fatigue varies between muscles and participants. Figure 3 shows the percentage change from DI1 to DI6 with the 95 percent confidence intervals.
DISCUSSION
By using the EMG data to compare participants’ localized fatigue levels from the end to the beginning of the 30-minute robot exercise, as expected, localized fatigue can be seen in majority of the muscles. For the triceps brachii, localized muscle fatigue consistently occurs for all participants. However, more than half of participants did not experience flexor capri radialis fatigue. They may have been compensating for this muscle with the biceps brachii in the flexion motion.
Based on a DI6/DI1 value larger than one indicating fatigue onset, participants three and 12 are the only participants who have less than five of the seven measured muscles locally fatigued. These participants also reported lower changes of fatigue NRS: zero and two, respectively. This further validates the use of EMG data and the Dimitrov index for the assessment of robot users’ fatigue levels.
Fatigue onset can vary greatly between participants (Figure 3). The largest variations between participants are seen with the flexor capri radialis and medial deltoid. Tseng, Billenger, Gajewski, and Kluding (2010) report that fatigue onset depends on an individual’s activity levels. Dimitrova et al. also acknowledge that recruitment patterns of motor units can vary by participant and muscle. Therefore, statistical analysis of combined participant or muscle data may not be useful in analysis of fatigue.
Future work will include correlating the EMG data with robot-collected parameters, including speed, accuracy, and smoothness. The most fatigued muscle, which varies between participants, may be analyzed in order to avoid overworking that muscle. This will lead to the development of a safer device.
After modification of the AI model, the system will be tested on healthy and stroke-survivor participants. Knorr, Ivanova, Doherty, Campbell, and Garland (2011) found higher central fatigue on the paretic limb opposed to the non-paretic limb for post-stroke patients. Therefore, this demographic may find the exercise more challenging than healthy participants.
From Figure 2, muscle recovery can clearly be seen between the exercise intervals for the biceps brachii and triceps brachii. For the extensor capri radialis longus, muscle recovery can be seen within an interval. Since a muscle is either more active in flexion or extension, it has the chance to recover in the opposite motion (McGinnis, 2005). Recovery rates can also depend on the participant’s activity level (Tseng et al., 2010).
Limitations
The Dimitrov index emphasizes lower frequencies and deemphasizes higher frequencies. It is a conservative way to calculate fatigue, and it is believed to be suitable when addressing patient safety. However, because of the overemphasis, data that may seem like outliers in the Dimitrov index may not exist in the mean frequency dataset (e.g. participant seven’s MD in Table 1).
From Table 1, participant 11 felt less fatigued after the exercises although s/he had some large changes in muscle Dimitrov indices, with the exception of the AD. It appears that localized muscle fatigue was not affecting his/her central fatigue level.
CONCLUSIONS
Although additional analysis is required to improve the AI model, this study concludes that using an upper limb rehabilitation robotic device will cause localized muscle fatigue based on EMG data, even for healthy participants. This data will be further analyzed with data parameters collected from the robotic system and used to modify the AI model integrated with the robotic system in order to build a safe device for post-stroke therapy.REFERENCES
Cutter, C.C., & Kevorkian, C.G. (1999). Handbook of Manual Muscle Testing. New York:McGraw Hill.
Dimitrov, G., Arabadzhiev, T.I., Mileva, K.N., Bowtell, J.L., Crichton, N., & Dimitrova, N. (2006). Muscle fatigue during dynamic contractions assessed by new spectral indices. Medicine and science in sports and exercise, 38(11), 1971-1979.
Dimitrova, N.A., Arabadzhiev, T.I., Hogrel, J.Y., & Dimitrov, G.V. (2009). Fatigue analysis of interference EMG signals obtained from biceps brachii during isometric voluntary contraction at various force levels. Journal of Electromyography and Kinesiology, 19(2), 252-258.
Dimitrova, N.A. & Dimitrov, G.V. (2003). Interpretation of EMG changes with fatigue: facts, pitfalls, and fallacies. Journal of Electromyography and Kinesiology, 13(1), 13-36.
González-Izal, M., Malanda, A., Navarro-Amézqueta, I., Gorostiaga, E.M., Mallor, F., Ibañez, J., & Izquierdo, M. (2010). EMG spectral indices and muscle power fatigue during dynamic contractions. Journal of Electromyography and Kinesiology, 20(2), 233-240.
Kan, P., Huq, R., Hoey, J., Goetschalckx, R., & Mihailidis, A. (2011). The development of an adaptive upper-limb stroke rehabilitation robotic system. Journal of NeuroEngineering and Rehabilitation, 8(33).
Knorr, S., Ivanova, T.D., Doherty T.J., Campbell, J.A., & Garland, S.J. (2011). The origins of neuromuscular fatigue post-stroke. Experimental Brain Research, 214(2), 303-315.
Larivière, C., Arsenault, A.B., Gravel, D., Gagnon, D., & Loisel, P. (2002). Evaluation of measurement strategies to increase the reliability of EMG indices to assess back muscle fatigue and recovery. Journal of Electromyography and Kinesiology, 12(2), 91-102.
Lu, E.C., Wang, R., Huq, R., Gardner, D., Karam, P., Zabjek, K., Hebert, D., Boger, J., & Mihailidis, A. (2011). Development of a robotic device for upper limb stroke rehabilitation: A user-centered design approach. Paladyn. Journal of Behavioral Robotics, 2(4), 176-184.
McGinnis, P.M. (2005). Biomechanics of Sport and Exercise (2nd ed.). Champaign: Human Kinetics.
Merletti, R., Knaflitz, M., & De Luca, C.J. (1990). Myoelectric manifestations of fatigue in voluntary and electrically elicited contractions. Journal of Applied Physiology, 69(5), 1810–1820.
Oujamaa, L., Relave, I., Froger, J., Mottet, D., & Pelissier, J.Y. (2009). Rehabilitation of arm function after stroke. Literature Review. Annals of Physical and Rehabilitation Medicine, 52(3), 269-293.
Public Health Agency of Canada. (2009). Tracking Heart and Stroke in Canada. Retrieved January 6, 2012, from the Public Health Agency of Canada website: www.publichealth.gc.ca.
Roger, V.L. et al. (2011). Heart Disease and Stroke Statistics – 2012 Update: A Report From the American Heart Association. Circulation, 125, e2-e220.
SENIAM. (n.d.) Sensor Locations. Retrieved July 24, 2012, from www.seniam.org.
Søggard, K., Blangsted, A.K., Jørgensen, L.V., Madeleine, P., & Søggard, G. (2003). Evidence of long term muscle fatigue following prolonged intermittent contractions based on mechano- and electrograms. Journal of Electromyography and Kinesiology, 13(5), 441-450.
Tseng, B.Y., Billenger, S.A., Gajewski, B.J., & Kluding, P.M. (2010). Exertion fatigue and chronic fatigue are two distinct constructs in people post-stroke. Stroke, 41(12), 2908-2912.