SMART Belt: A Low-cost Seizure Detection Device (Rice University)
Ethan Leng, Mihir Mongia, Charles Park, Tiffany Varughese, Andrew Wu
 ABSTRACT
Epilepsy is a chronic neurological disorder characterized by recurrent seizures which affects 2.2 million people in the United States (1). Seizures often present serious, potentially life-threatening symptoms. In the event of a seizure, caregivers must be alerted quickly to provide immediate medical attention. Existing outpatient seizure monitoring devices are costly and perform unreliably (1). To facilitate reliable, more accessible seizure detection, we have developed the Seizure Monitoring and Response Transducing (SMART) Belt, a wearable, multi-sensor device designed to provide continuous outpatient monitoring for people who experience epileptic seizures. The device measures patients’ respiration and electrodermal activity, and uses synchronized changes in both to alert caregivers at the onset of a seizure. The SMART Belt, which costs only $100 to produce, will make seizure detection in the outpatient setting cheaper, more accessible, and more reliable, and improve the quality of life for people who have epilepsy.
YouTube at http://youtu.be/x79Ddpye-TI
BACKGROUND
Epilepsy
Seizures generally result from abnormal electricity activity in the brain. Contrary to popular perception, most seizures are non-convulsive and tend to present with much more subtle symptoms (1-2). One such symptom during the course of a seizure is an increase in sympathetic nervous activity, while post-seizure symptoms generally include a decrease in the activity levels of the area(s) of the brain affected by the seizure. If these areas are responsible for autonomic control, abnormalities in the heart and respiratory muscles may occur, causing aberrant cardiac rhythms and breathing patterns. These abnormalities are thought to be primarily responsible for cases of sudden death in epilepsy (SUDEP), a relatively uncommon but serious consequence of epilepsy (1,3).
Current Detection/Monitoring Methods
There exist few technologies for seizure detection. The gold standard is electroencephalography (EEG), which records the electrical activity of the brain. Though EEG is very accurate, it has only be used for real-time seizure detection in a hospital setting (1,4). The only other existing devices are vibration sensors, which are placed under the mattress and record body movements during sleep. Any extended periodic movements are assumed to be seizure activity. As a result, these sensors have very poor accuracy. For example, one such device demonstrated a specificity of 62.5% (>250 false positives) in 1528 total hours of continuous monitoring. Furthermore, these sensors can miss more than 80% of non-convulsive seizures (5). It is clear, then, that new approaches to seizure detection are required.
PROBLEM STATEMENT
People who have refractory epilepsy experience recurrent seizures and do not respond to treatment. They require close monitoring so that when they experience a seizure, caregivers will be ready to take necessary actions to prevent injury or death. In many cases, family members are the caregivers who bear the burden of having to stay constantly vigilant, knowing that a seizure can occur at any time. Notably, many parents report getting little to no sleep at night, as they stay up worrying about the next seizure their children who have epilepsy will experience. Therefore, a method of accurately detecting seizures in an outpatient setting is needed (especially at night) to alleviate the uncertainty and anxiety caregivers often feel about the random nature of epilepsy and to alert them quickly when a seizure does occur.
SOLUTION/DESIGN OBJECTIVES
To allow greater autonomy and independence for people who have epilepsy, we have built the SMART Belt, a wearable, wireless device for seizure detection. Because certain synchronized changes in respiratory patterns and skin conductance are well-correlated with the occurrence of seizures (6,7), the SMART Belt combines a respiration sensor and an electrodermal activity (EDA) sensor into a discreet form factor that can be comfortably worn for extended periods of time. After research and consultation with our sponsor Cyberonics, Inc. about the needs of people who have epilepsy and their caregivers, the following design objectives were identified:
- -Accurate measurements of physiological signals
- -Maximization of user comfort and device wearability
- -Minimal cost
- -Minimal power consumption
- -Wireless data transmission
METHODS/APPROACH
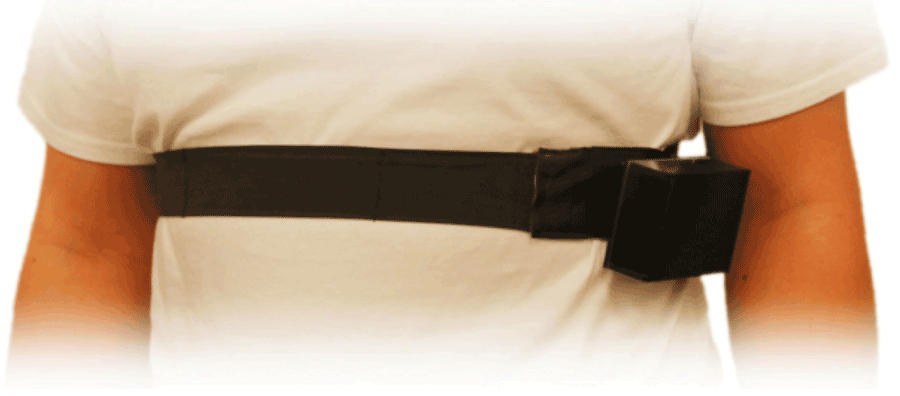
The SMART Belt is a band that integrates a respiration sensor and an EDA sensor (Figure 1). It has dimensions of 32 in by 2 in and is designed to be worn around the broadest part of the ribcage (either directly over or slightly posterior to the diaphragm for most body types).
Respiration Band
The respiration band consists of a piezoresistive elastic sensing portion and a non-elastic portion. The ends of the two portions are sewn together, and the two ends of the non-sensing portions are then snapped together to secure the belt to the torso (Figure 1). The electronic module is attached to the belt via connection snaps. When the belt is worn, the elastic fabric stretches and relaxes in sync with the expansion and contraction of the diaphragm and the ribcage. This in turn changes its resistance, which can be measured with on-board analog circuitry. An algorithm was developed to calculate real-time respiration rate from obtained data.
EDA Sensor
The EDA sensor is composed of two reusable electrodes that are placed a short distance apart and in contact with the skin. The electrodes are connected to an analog circuit that measures the skin conductance between the electrodes, which increases primarily due to sympathetic nervous activity (7). To combine two separate sensors into a single wearable device, we believed it would be best if the electrodes could be incorporated into the housing of the respiratory belt. Thus, the electrodes were be placed 4 cm apart on the side of the torso at the level of the T9 thoracic vertebrae, which has not been done before on previous commercial devices (Figure 2).
Circuitry and Data Transmission
 Figure 3. Diagram of the PCB with important parts labeled.
A printed circuit board (PCB) was used to integrate all of the electronic components of our device (Figure 3). The board contains an MSP430 microcontroller for processing data, an RN-42 Bluetooth module for transmitting wireless alerts, analog circuitry for both sensors, voltage regulators, and a rechargeable battery, all of which make the device portable.
TESTING AND EVALUATION
Testing on healthy adults under our Institutional Review Board-approved protocol has been conducted to determine the comfort and accuracy of the SMART Belt. We have also issued post-testing surveys to gauge the comfort level of our device and to obtain suggestions about how to improve our device. Testing of other elements of our design such as power consumption and proper microcontroller function has also been performed.
Testing Results: Respiration Sensor
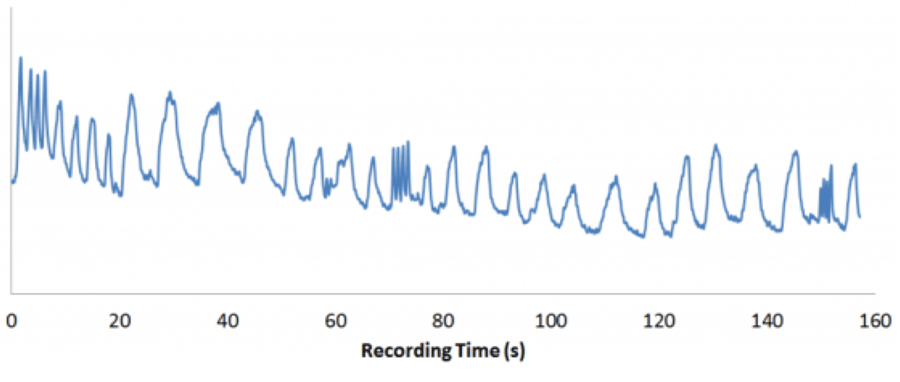 Figure 4. Sample signal from the respiration sensor as the subject varies his breathing. Each oscillation corresponds to a breath, making it apparent where the subject is changing his breathing.
To test our respiration sensor, people wearing the SMART Belt and the BIOPAC commercial respiration sensor were instructed to breathe while varying the frequency and depth of breathing. Representative testing results from our respiration sensor are shown (Figure 4).
Figure 4. Sample signal from the respiration sensor as the subject varies his breathing. Each oscillation corresponds to a breath, making it apparent where the subject is changing his breathing.
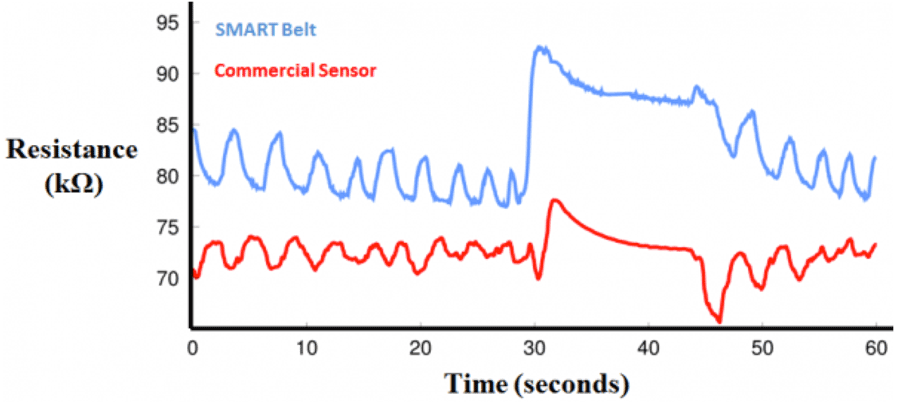 Figure 5. Plot of data obtained by the respiration sensor on the SMART Belt (blue) and data obtained by the commercial BIOPAC respiration sensor (red).
Thus far, our respiration sensor and algorithm have worked very well. Data from testing sessions lasting 3 to 5 minutes where the subject intentionally varied his respiration look clean with clear peaks and valleys that correspond to breaths. Furthermore, the average error of breath detection for our breath detection algorithm has been around 2.9% (n=5) with a range of 0.9% to 5.3%, and the number of breaths detected by the algorithm over the recording time has been accurate within 1 to 2 breaths. Visual comparison of data obtained by the two sensors shows very good correlation in the resistance change of the devices (Figure 5); notably, the same number of peaks and valleys appear in both plots.
Testing Results: EDA Sensor
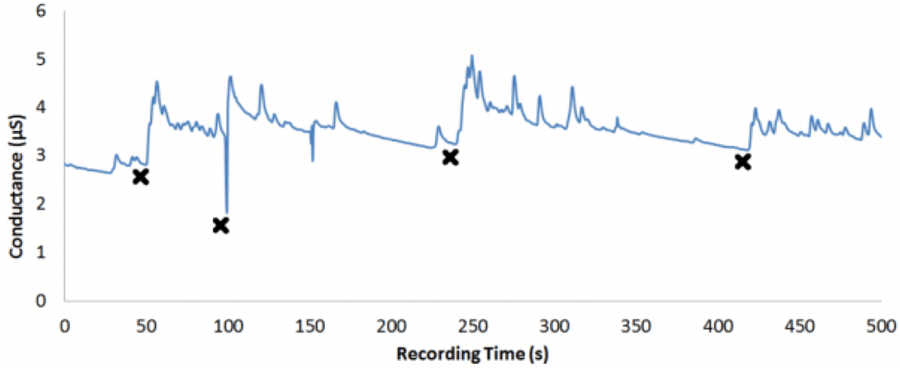 Figure 6. Sample signal from the EDA sensor on the side of the torso. Black X's mark the times where an external stimulus was given to the subject. Sharp increases in skin conductance generally indicate a sympathetic nervous response.
To test our EDA sensor, people wearing both the SMART Belt and the BIOPAC EDA sensor (which measure EDA across adjacent fingertips) were subject to a variety of physical, mental, and audiovisual stimuli that are known to trigger sympathetic nervous responses. Due to the fact that the characteristics of the EDA response vary significantly depending on where it is measured, we decided that it would be best to mark down where stimuli occurred and then review the data to see if the stimuli corresponded to sudden increases in EDA. Sample testing results for the EDA sensor are shown (Figure 6).
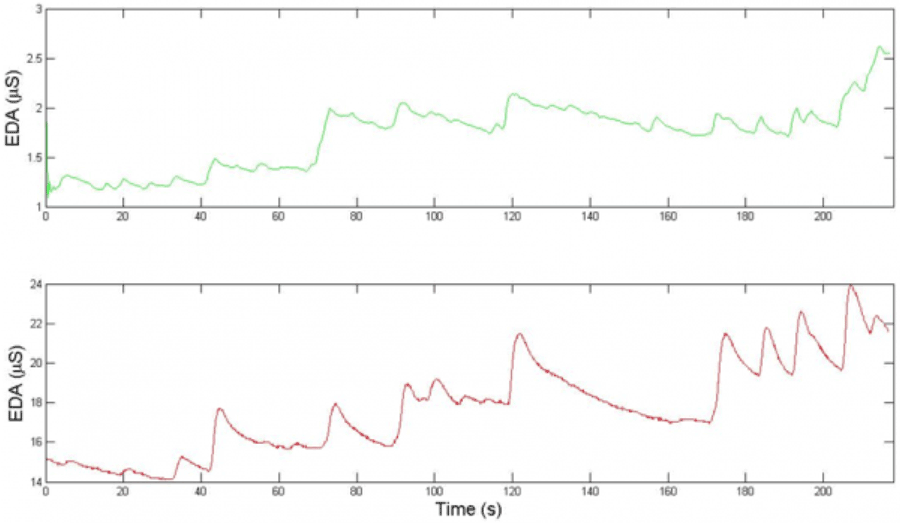 Figure 7. Comparison of data obtained from our EDA sensor placed on the side of the torso (above) and data obtained from the BIOPAC sensor placed on the fingertips (below). While the magnitudes of the changes in EDA are different, the times at which significant increases occur (corresponding to sympathetic stimulation) are quite consistent, which is the most important aspect of recording EDA.
The accuracy of the EDA signal obtained by our EDA sensor was quantified by comparing the data obtained by our EDA sensor to that obtained by the BIOPAC EDA sensor. The signals from our sensor compares favorably with that from the BIOPAC sensor. The average correlation between the data obtained by the two sensors is between 80% and 84% (n=5), as measured by the Pearson correlation coefficient (Figure 7).
Testing Results: Device Comfort
| Component | Cost |
|---|---|
| EDA pellet electrodes | $5.00 |
| Conductive fabric | $1.93 |
| Vinyl | $6.31 |
| Lithium battery | $11.95 |
| Electronic components | $60.28 |
| Black thread | $0.50 |
| Plastic for electronic module | $0.79 |
| Printed circuit board (PCB) | $163.30 |
| Total | $250.06 |
| Total without PCB | $86.76 |
After wearing the SMART Belt, people were given a survey that asked them to evaluate the comfort, attachment, and weight of the SMART Belt compared to commercial sensors. Generally, subjects felt that the SMART Belt was comfortable and was securely attached, and rated it equal to the BIOPAC respiration belt in these categories. However, they reported that the SMART Belt was relatively heavy. This was most likely due to the weight of the electronic module. In future iterations, we will attempt to minimize the size of the battery, circuit board, and case to decrease the weight of the electronics module.
Testing Results: Battery Life
Power consumption was determined by first fully charging the battery, turning on the device, and letting it run until the battery was depleted. The battery life was determined to be 9.8 hours (n=3) of continuous operation.
COST
The components of our initial prototype cost a total of around $250, as itemized in Table 1. However, production costs can be significantly reduced via mass production of circuit boards. By purchasing our electronic components and manufacturing them in bulk, we estimate that our manufacturing cost can be reduced to $100 per board. Given that existing commercial bed vibration sensors cost around $390, we would be able to sell our device at a very competitive price. This in turn would make our device more accessible to people who have epilepsy and their caregivers.
DISCUSSION
Our SMART Belt meets nearly all design objectives that we specified. We achieved our primary goal of creating an inexpensive standalone device that smoothly integrates a respiration sensor and an EDA sensor, both of which perform comparably to existing commercial sensors. The device is energy efficient enough that it can run and transmit data continuously for at least 8 hours, which is long enough for one night of continuous monitoring. We anticipate that the battery life will be much longer once the PCB is programmed to transmit only periodically instead of continuously. The SMART Belt is comfortable to wear and remains securely attached when worn. We envision that the SMART Belt will make outpatient seizure detection cheaper, more accessible, and more reliable, and will improve the quality of life for people who have epilepsy.
REFERENCES
- Fisher, R., & Saul, M. (2006). Overview of Epilepsy. Retrieved from http://neurology.stanford.edu/divisions/EpilepsyHandout.pdf
- Devinsky, O. (1999). Patients with refractory seizures. New England Journal of Medicine, 340, 1565-1570.
- So, E.L. (2008). What is known about the mechanisms underlying SUDEP? Epilepsia, 49(9), 93-98.
- Kharbouch, A., Shoeb, A., Guttag, J., Cash, S.S. (2011). An algorithm for seizure onset detection using intracranial EEG.Epilepsy behavior, 22(1), 29-35.
- Carlson, C., Arnedo, V., Cahill, M., Devinsky, O. (2009). Detecting noctural convulsions: efficacy of the MP5 monitor.Seizure, 18(3), 225-227.
- Moseley, B.D., Wirrell, E.C., Nickels, K., Johnson, J.N., Ackerman, M.J., Britton, J. (2011). Electrocardiographic and oximetric changes during partial complex and generalized seizures. Epilepsy Reseearch, 95(3), 237-245.
- Poh M.Z., Loddenkemper, T., Reinsberger, C., Swenson, N.C., Goyal, S. Madsen, J.R., Picard, R.W. (2012). Autonomic changes with seizures correlate with postictal EEG suppression. Neurology, 78(23), 1868-1876.
ACKNOWLEDGEMENTS
This project was sponsored by Cyberonics. The design work for this project was supported by the resources of the Oshman Engineering Design Kitchen at Rice University. We would especially like to thank our mentors Steve Maschino, Gary Woods, Maria Oden and Danielle Wu for their advice, ideas and support.