Ian Dewancker2, Jaimie F. Borisoff1, Boyang Tom Jin2, and Ian M. Mitchell2
1British Columbia Institute of Technology,
2Department of Computer Science, University of British Columbia
Introduction
Mobile devices such as phones and tablets are now ubiquitous and have become important tools in our daily lives. Our activities and behaviours are becoming increasingly coupled to these new devices with their ever improving sensor technologies. With current devices, mobility patterns and physical activity levels are particularly amenable to inference and analysis by leveraging the integration of GPS, accelerometers, and other sensors. Coupled with feedback through display screens, speakers, and vibration, mobile technology has reached a level of sophistication that it now presents as an attractive platform for assistive technology research and health-related applications.
The electronic health movement has made great strides in improving access to health care information by using Internet technologies. An obvious next step in this progression is to leverage both Internet and mobile technologies and investigate mobile health, or mHealth, applications (Open mHealth, 2013) that move towards further personalization and assistive capabilities. In a more general sense, the quantified self movement (Quantified Self, 2013) aims to promote self-improvement through consistent data collection and analysis. The underlying philosophy of the quantified self movement is that consistent measurement of and reflection on important personal metrics leads to an almost instinctive improvement in behaviour. There are a growing number of quantified self tools for improving lifestyle or behavioural habits such as diet, exercise, and time management. Of particular interest to assistive technologists and rehabilitation scientists is measurement of a person's mobility, which is an important factor in assessing quality of life (Schenk et al., 2011).
Several systems have been built in recent years that explored mobility sensing and reporting to varying degrees. UbiFIT (Consolvo et al., 2008) was designed to track physical activity (i.e. walking) and provide on-phone visual feedback with a simple intuitive display, although users wore a separate pedometer that communicated with the phone. FUNF, an open source sensing framework for Android (Pentland, Aharony, Pan, Sumter, & Gardner, 2013), provided an extensible framework for capturing a wide variety of sensor data from a device and publishing it to a web service. HumansSense (Frank, 2013) is an open source data collection platform on Android, capable of logging sensor data and uploading to a web service. A proof of concept system for lifespace recording that utilized pre-placed bluetooth beacons in the home and mobile phones has been demonstrated (Schenk et al., 2011). The open mHealth initiative (Open mHealth, 2013) recently proposed a standardized architecture for mHealth and reporting applications. Ohmage, the open mHealth sensing platform (Hicks et al., 2011), allows for data collection on a phone with the ability to upload data to a web service for summarizing and visualizing reports for users. The application has been used to track users' activity levels and has also been applied in other studies, e.g. monitoring stress levels in new mothers (Ohmage, 2013).
Towards these ends, we investigated and designed the MobiSense system to track lifespace and monitor activity of both ambulating persons and wheelchair users using standard mobile phones (Dewancker, 2014). To fully report about a user's lifespace and activity, the system has three basic components: 1) outdoor mobility tracking; 2) indoor mobility and localization; and 3) activity level recognition. The focus was on techniques that perform well with available sensors and in real-world environments using standard mobile phones.
The general goals of the MobiSense project are: 1) to collect mobility data in a simple to use manner; 2) to provide easily accessible summaries and analysis of daily behaviours; and 3) to enable further research and development by providing a sandbox environment for rapid prototyping and experimentation. The specific objectives of the research reported here are to leverage mobile data collection technology and centralized analysis to detail a wheelchair user's daily activity; thus, we developed a system based on Android phones, cloud computing and storage services, and custom web services.
Methods and Results
The MobiSense system is capable of lifespace summaries relating to indoor and outdoor mobility as well as activity trends and behaviours. Indoor localization is done at roughly room level using the relative signal strengths of all nearby WiFi base stations. Outdoor mobility summaries are captured by periodically recording GPS fixes. Activity classification uses a combination of accelerometer and GPS features, enabling differentiation between stationary, wheeling (in a wheelchair), walking, or vehicle motion. To capture the relevant sensor data, we extended an Android-based open source logging application which records data streams locally on a mobile phone before uploading data to a custom web service to process and visualize results. The resulting summaries can be visualized either for each individual day or over a user-selected date range. A heat map visualization was used for display of outdoor lifespace to understand the geographic extent of a user's mobility. For indoor localizations and activity summaries, pie charts and temporal series display trends in a user's mobility.
System Architecture
MobiSense builds on the HumanSense project (Frank, 2013) and couples it with a new web service in the spirit of Ohmage (Hicks et al., 2011) and the open mHealth architecture (Open mHealth, 2013). The system uses a standard Android Nexus 4 phone with no hardware modifications; the web client can be viewed from any browser on any platform. The centralized processing and storage of the data streams lives on a single Amazon EC2 instance running Ubuntu Linux. The Tornado web server is used to handle data uploads and requests for lifespace summaries.
Phone Application and Sensor Logging
The MobiSense phone application is a modification of HumanSense, which logs many of the sensors supported by Android. For our lifespace measurements, MobiSense only stores WiFi, GPS, and accelerometer readings. The data are stored as binary files compressed with gzip on the phone's SD card. The WiFi, GPS, and accelerometer sensors are polled every 10, 60, 0.05 seconds, respectively. For indoor localization and WiFi logging, MobiSense stores the number of WiFi access points observable, their signal strengths, and network and device identifiers (i.e. SSID and BSSID or MAC address). For outdoor localization and GPS logging, MobiSense stores only the longitude and latitude of each GPS fix. For activity monitoring, MobiSense uses the GPS data and the magnitude of the tri-axis acceleration adjusted for gravity, the same univariate signal used in (Hicks et al., 2011).
A basic user interface for the phone was designed to provide hooks into the most important actions associated with the application. A central button starts the logging service. When pressed, the application begins recording sensor streams and storing the data locally on the device. To stop the service, the user presses the same button again and another service uploads the recorded files. Below the start button, an area of the interface is used for creating an indoor location model. The plus (+) button is used to name new rooms for training. Another button starts recording WiFi observations for training data on the currently selected room. It records observations every 800 ms and stores the training data for upload to the web service. A user can train the indoor model by lingering and moving within a particular room for a minute or two. Once the system is trained with each room of interest, no user input is needed other than charging the phone each night and physically carrying it throughout the day.
Since the application is expected to collect data over the course of a full day, an important consideration is the amount of data that the sensor logging produces. For an 18 hour recording period with full accelerometer, WiFi, and GPS logging, roughly 15 MB of compressed (50 MB uncompressed) sensor data is typically collected. The compressed files are uploaded to the web service only when the phone has a WiFi Internet connection. Once the data has been processed, its summarization format is quite compact, with each day producing only about 100 KB. Another important consideration for any mobile application is battery usage. With little screen use and no calls made or received, MobiSense was able to run on a single battery charge on a Nexus 4 phone for 22 hours.
Data Processing: Feature Selection and Classification
A probabilistic classifier scheme was used for indoor localization at the room level. Introduced in (Breiman, 2001) and shown to be useful for WiFi localization in (Balaguer, Erinc, & Carpin, 2012), random forests are ensemble learners that use a collection of decision trees to classify test observations. Here, observations are the relative signal strengths of WiFi access points visible to the mobile device. For activity recognition, we fuse features derived from non-overlapping windows of accelerometry data, as proposed in (Frank, Mannor, Pineau, & Precup, 2012; Hicks et al., 2011), with an average speed estimate derived from the sequence of GPS fixes. We consider the mean and Fourier series coefficients of the accelerometry time series combined with the GPS speed estimate to learn a single decision tree, similar to (Hicks et al., 2011), capable of distinguishing between stationary, walking, wheeling, and vehicle motion.
To evaluate the indoor localization, we collected 5 datasets in a variety of indoor environments including 3 homes, 1 apartment and 1 office environment. To further test the robustness of the classifier five simulated datasets, that are modified versions of the originals, were created, where each observation vector had 20% of its access point observations set as if the access point was turned off (to simulate conditions with many fewer visible access points). Across all datasets, the random forests had an average classification accuracy of 91% (Dewancker, 2014). To test our activity classifier, training and test data was collected with the phone in four configurations. The user either walked or used a wheelchair and either had the phone placed in their front pocket or backpack. Across all classes on the test data the minimum accuracy for activity classification was 95% (Dewancker, 2014).
Data Visualization
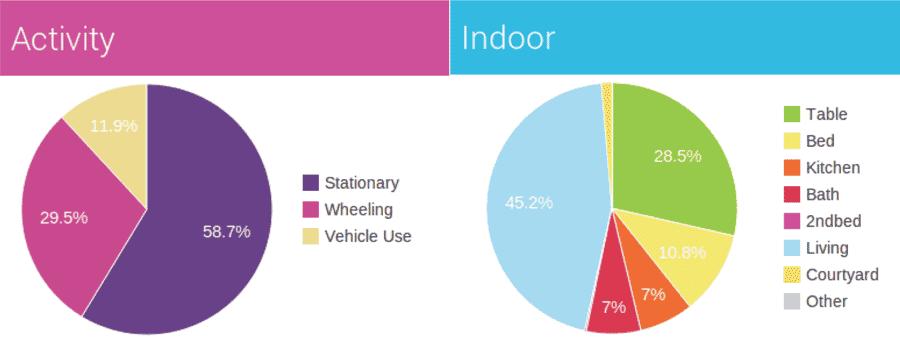 Figure 1: Pie Charts Summarizing Distribution of Activities and Rooms
A visualization component is present in many lifespace and actigraphy applications and is key to guiding data interpretation (Fitbit Inc., 2013; Hicks et al., 2011; Schenk et al., 2011). MobiSense provides user feedback and summarization visualizations through a custom web client. Many of the visualizations are styled after the lifespace visualizations presented in (Schenk et al., 2011). First a user specifies the date range to be summarized. A slide bar with two adjustable ends allows for selection over the range of dates that the user collected data. The user also has the option of visualizing each individual day over that range (Daily), or an aggregate summarization (Total). Once a range has been selected the site generates requests for the three summary streams from the MobiSense server.
The outdoor summary data is a stream of GPS fixes displayed using the Google Maps API (Google Inc., 2013) to generate a heat map distribution of logged GPS locations. Frequently logged locations produce larger, darker heat centers. In addition, trace lines can be added to connect consecutive fixes. This is a fairly standard map visualization, so we do not include a screenshot here.
The visualizations for the activity and indoor timelines are closely related in that they are summarizing classifications over the course of a day. Pie charts visualizing the distribution of time spent in each activity class for the activity summarization and each room for the indoor summarization are created for the user (Fig.1). Users can also mouse over the sections of the pie chart and see absolute minutes logged for each activity class or room. Here, as for the outdoor summary, the visualization stays the same whether the user requests individual day summaries or the total aggregation over the entire timeline.
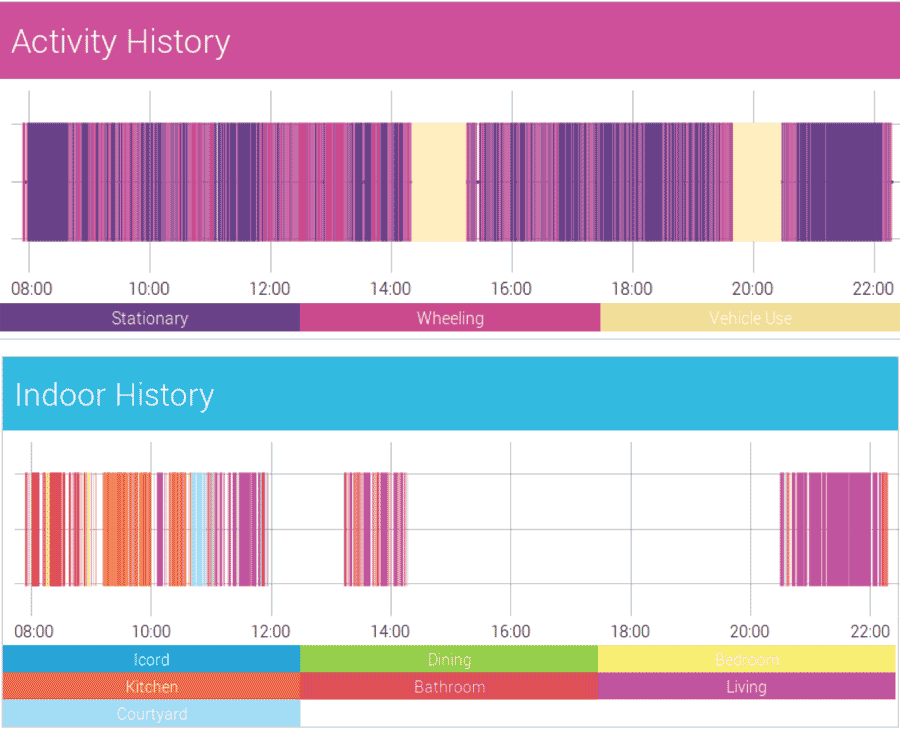 Figure 2: Activity and Indoor Daily Timeline Summary
The pie chart works well for a quick summary of the user's time; however, temporal trends are also likely of interest to users for behaviour analysis. The time series visualizations are designed to show specifically when classifications occur during the day as a color-coded timeline (Schenk et al., 2011). Figure 2 presents an example summary for one of the authors on May 19, 2013. There are only three classes of interest for the activity summary, while the number of rooms for the indoor summary depends on the training model. In this example we can see the descriptive power of this visualization. The user begins the day in the bathroom and bedroom for about 50 minutes, then spends some time in the kitchen and living room before leaving the house at around noon. The user returns to the house at 1 pm and then leaves by vehicle at 2 pm, returning around 9 pm.
The previous visualizations were used to plot single days; however, if the user requests a total aggregation over the dates of interest, a different summary is presented. The MobiSense server aggregates over each day in the range and sends a single sequence that represents the entire date range. The timeline is populated with predetermined intervals of 10 minutes over the course of 24 hours, and each interval stores a probability distribution of the classes for that time over the date range. For example, if the user selects a range of 10 days and for 3 of those 10 days the user was classified as being in their bathroom from 8:10 to 8:20, then for that interval being in the bathroom would be visualized with a probability of 0.3. The total 24 hour timeline is visualized as a stacked line chart, where each interval is a distribution of classifications that add up to 1 (Fig. 3).
DISCUSSION and Conclusion
We proposed MobiSense as a research platform for lifespace summaries using mobile phones. The combination of simple timeline selection with rich visualizations could act as powerful explorative tools for researchers as well as users interested in their own patterns and behaviours. Extensions and improvements to the system are relatively straightforward to implement. A test instance of the system is currently hosted at http://mobisense.ca. Readers are invited to demo the site using login ID: 71b82dc2885abaca.
Current Limitations
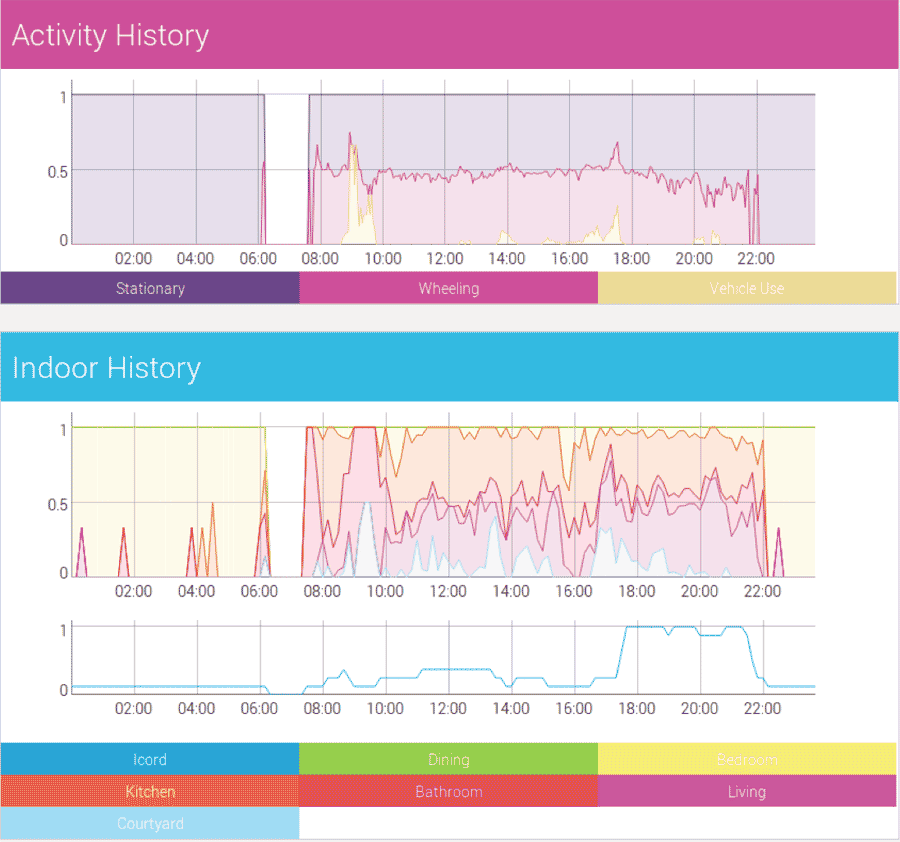 Figure 3: Total Summary Timeline Visualization
When proposing an entire system, many areas for future improvements arise. In particular, the development of a more robust classification scheme to distinguish between walking and wheeling activity classes is needed. In practice this may be less important since many users would typically either always walk or wheel. While the design of MobiSense was influenced by the system architecture of the open mHealth initiative, full adherence to the specification (once it becomes available) would be preferable to promote standards and collaboration. A serious aspect of any system is the concern about security and user privacy. Mobile health systems may potentially be storing sensitive and private user information and so great care must be taken to ensure that data is not compromised. Currently MobiSense does not have full security measures in place.
MobiSense and other systems are tools for exploring lifespace and behaviours. While passive summarization of information is an important step towards behavioural changes, future systems may also actively request information and make suggestions directly to users, incorporating assistive capabilities as an interactive agent. Ohmage (Hicks et al., 2011) and HumanSense (Frank, 2013) can query a user; however these requests are simple prompts for data or labeling. Extending the interactive abilities of MobiSense could, for example, enable the creation of very useful personalized reminders and alerts. Collaboration with other contextual systems would also be powerful; e.g. MobiSense could detect which room a user is in, as well as whether they are stationary or moving, and perhaps then displaying room-specific menus and commands. The introduction of Google Glass and other wearable systems presents another interesting future platform for data collection and visualization. With video recording and a small heads up display, interactions and data logging could potentially become much richer. We are beginning to see devices and systems that are more personalized and responsive than ever before. It is an exciting opportunity to apply some of these new systems to assistive technology and possibly improve quality of life and overall health.
References
Balaguer, B., Erinc, G., & Carpin, S. (2012). Combining classification and regression for WiFi localization of heterogeneous robot teams in unknown environments. Intelligent Robots and Systems (IROS), 2012 IEEE/RSJ International Conference On, pp. 3496-3503.
Breiman, L. (2001). Random forests. Machine Learning, pp. 5-32.
Consolvo, S., et al. (2008). Flowers or a robot army?: Encouraging awareness & activity with personal, mobile displays. Proceedings of the 10th International Conference on Ubiquitous Computing, Seoul, Korea. pp. 54-63.
Dewancker, I. (2014). Lifespace tracking and activity monitoring on mobile phones. (Master of Science Thesis, The University of British Columbia).
Fitbit Inc. (2013). Fitbit. http://www.fitbit.com/us
Frank, J., Mannor, S., Pineau, J., & Precup, D. (2012). Time series analysis using geometric template matching. IEEE Transactions on Pattern Analysis and Machine Intelligence,
Frank, J. (2013). Humansense android app. http://jwf.github.io/ Humansense-Android-App/
Google Inc. (2013). Google maps API. https://developers.google.com/maps/
Hicks, J., Ramanathan, N., Falaki, H., Longstaff, B., Parameswaran, K., Monibi, M., et al. (2011). Ohmage: An open mobile system for activity and experience sampling. CENS Technical Reports.
Ohmage. (2013). Ohmage projects. http://ohmage.org
Open mHealth (2013) Open mHealth. http://openmhealth.org
Pentland, A. S., Aharony, N., Pan, W., Sumter, C. & Gardner,A. (2013).Funf:Open sensing framework. http://www.media.mit.edu/research/groups/1448/funf-open-sensing-framework
Quantified Self. (2013). Quantified self : Self knowledge through numbers. http://quantifiedself.com/about/
Schenk, A. K., Witbrodt, B. C., Hoarty, C. A., Carlson, R. H., Goulding, E. H., Potter, J. F., et al. (2011). Cellular telephones measure activity and lifespace in community-dwelling adults: Proof of principle. J Am Geriatr Soc, 59(2), 345-352.
Acknowledgements
This research was supported by CanWheel (the Canadian Institutes of Health Research Emerging Team in Wheeled Mobility for Older Adults Grant #AMG-100925), the National Science and Engineering Research Council of Canada (NSERC) Discovery Grant #298211, an NSERC Undergraduate Student Research Award, and JFB’s Canada Research Chair in Rehabilitation Engineering Design.
Audio Version PDF Version