Functional Mobility Outcomes for Individuals with New Seating Systems
Penny J. Powers, PT, MS, ATPa, Allison Howell![]() b, Carolyn Hughesb, Dyan Morrisb, Allison Tooleb, Carrie Zilbauerb, Renee Brown, PT, PhDb
b, Carolyn Hughesb, Dyan Morrisb, Allison Tooleb, Carrie Zilbauerb, Renee Brown, PT, PhDb
aPi Beta Phi Rehabilitation Institute, Adult Seating and Mobility Clinic, Vanderbilt University Medical CenterbSchool of Physical Therapy, Belmont University
INTRODUCTION
There are wide variations in reported use of wheeled mobility in the United States. According to the University of California–Disability Statistics Center (2013), an estimated 1.7 million individuals in the United States use a wheelchair. The Americans With Disabilities: 2005 reported “Roughly 3.3 million people (1.4 percent) use a wheelchair or similar device” (Brault, 2008). Even though the estimates vary, there is an increase in the use of wheeled mobility due to the aging population and chronic health issues that limit mobility. Recent reports regarding fraud related to Medicare funds for powered mobility and reports of individuals being denied needed seating and mobility devices due to over restrictive requirements have increased the need to validate the functionality of patients with their prescribed devices (Greer, 2012). Reported personal adverse effects of long term wheelchair use include dysthymia, malnutrition, reduced social and leisure activities, lower life satisfaction, and increased use of home health care services (Hoenig, Landerman, Shipp, & George, 2003). Evans, Frank, Neophytou, and Souza (2007) stated that individuals have reported a sense of helplessness during wheelchair use.
Currently there is no consensus regarding the best tool to use to capture all aspects of functioning of individuals using wheeled mobility devices. Research regarding mobility users and functional outcomes are limited given the lack of standardization of the wheeled mobility service delivery model (Greer, 2012). There is little evidence to verify that new seating and mobility devices improve the functioning for patients. This lack of evidence affects providers’ ability to prescribe the most effective device based on objective findings and also diminishes the ability to evaluate new seating and mobility technology. Meeting consumer needs and obtaining adequate reimbursement for complex rehab technology are essential to improving the quality of life for those individuals with mobility impairments (Greer, 2012).
As of July 1, 2013, all those billing outpatient therapy services under Medicare Part B must submit functional limitation data (G-Codes) for any beneficiary, or claims will be returned unpaid. Therapists are required to determine levels of outpatient functioning using evidenced based tools/tests and establish plan of care and goals using those tools corresponding to the G-Codes. It is essential that those who work in seating and mobility continue to pursue utilization of valid outcome measures and participate in clinical research as funding by CMS for services will be reconfigured based on outcomes data. (APTA, 2013)
In order to determine if patients’ function improves with a newly prescribed wheelchair, several tools have been developed. In our study, The Functional Mobility Assessment (FMA) was used to assess the change in functioning in subjects following receipt of a new seating and mobility device. The FMA is a tool that has ten statements addressing the subjects’ ability to function while using their current mobility device. Kumar (2013) determined that the test-retest reliability scores were ≥0.80.
This study examined the change in reported functional outcomes of patient receiving a new wheelchair or seating system using the FMA. The difference in patient’s reported function indicates whether the prescription the individual received is meeting his or her needs by improving their function and potentially minimizing adverse long term effects of an improperly configured seating system. Our previous study included only patients with non-progressive disorders (Powers, 2013). This study included individuals both with progressive and non-progressive disorders.
Methods
Subjects
Subjects were eligible to participate if they were 18 years of age or older and after receiving a physical therapy evaluation were prescribed a new wheelchair and/or seating system through the Adult Seating and Mobility Clinic. Subjects were excluded if they met any of the following criteria: under the age of 18, unable to provide consent and a legal representative was not able to provide consent, or not able to communicate via the phone. Caregivers could provide the information via phone if appropriate consent was provided. At the time the informed consent was obtained, the subjects were provided with a copy of the FMA to use during the phone interviews. Fifty subjects were recruited for the study. Forty-five completed the pre-fit or post-fit FMA. Fourteen completed both the pre-fit and post-fit FMA. Thirteen of those that completed both the pre-fit and post-fit had progressive disorders.
Procedure
The subjects were recruited at the time of the evaluations. They were contacted by phone 7-10 days after the initial evaluation, consent was confirmed and the FMA was administered. The subjects were then contacted again 15-20 days after receiving their new seating system and the FMA was re-administered. Any qualitative comments were noted for further analysis.
RESULTS
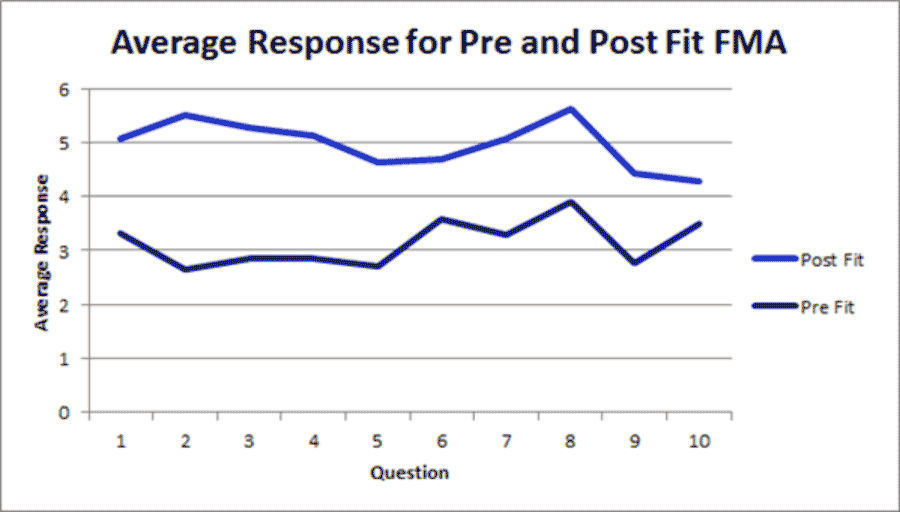 Figure 1
The average of all FMA post-fit response for each question was higher than the average all pre-fit response, indicating a higher level of functioning with their new seating system. (Figure 1)
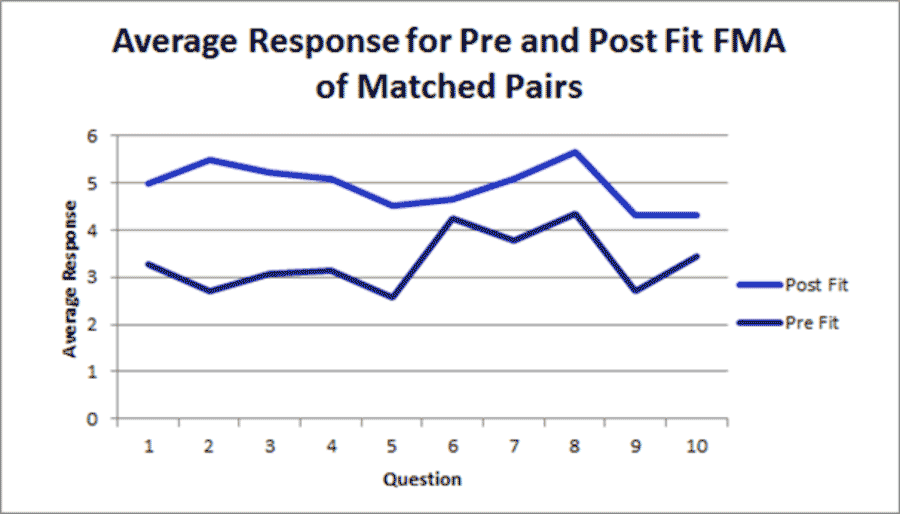 Figure 2
The greatest change between the pre-fit and post-fit responses was in question 2 which relates to the subjects’ comfort needs. The least change was seen in question 6, subjects’ ability to transfer with their seating system and question 10, ability to access personal and public transportation.
Using only the 13 subjects with progressive disorders who completed both the pre-fit and post-fit FMA, the post fit FMA averages were higher than the pre-fit FMA indicating improved function with their new seating system and device. (Figure 2)
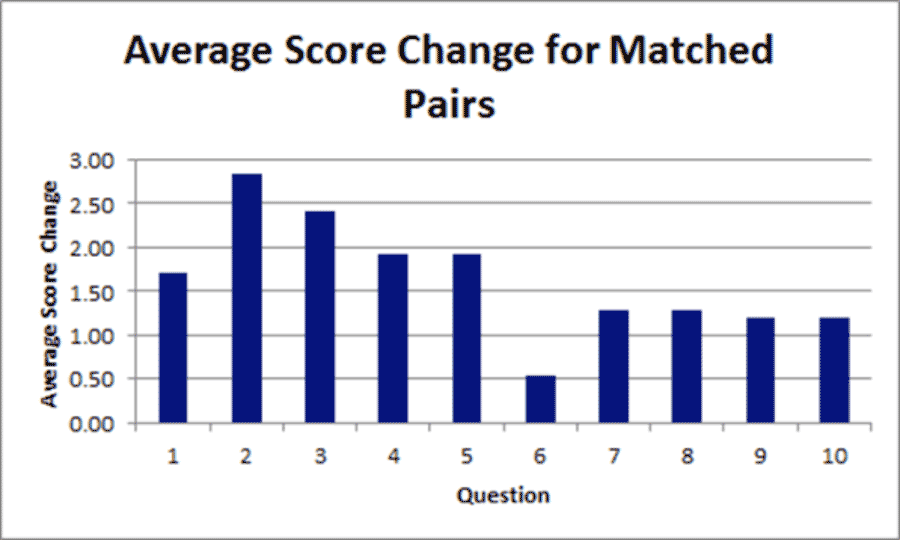 Figure 3
The responses were similar for the matched pairs as with all respondents with comfort showing the greatest change along with meeting their health needs. Transfer ability and transportation had the least reported change.
Figure 3 presents the average change between the pre-fit responses and post-fit responses for the matched pairs with progressive disorders.
DISCUSSION
The higher average post fit response for all questions indicates that overall the subjects reported increased functioning with their new seating systems. This validates that the newly prescribed seating system improved their functional ability. The largest reported improvements were in comfort level and health needs.. Comfort may have be the one of the primary reason for individuals seeking a new seating system. The improvement in comfort level for these individuals can be very important in minimizing the detrimental effects of long-term wheelchair use. These include musculoskeletal deformities, pulmonary and cardiovascular compromise and most importantly the development of skin ulcers. A seating system that is properly fit can minimize these long-term complications leading to improved quality of life and decreased health care costs. DiGiovine, et al (2013) presented similar results during the International Seating Symposium. They reported a higher response for all questions on follow-up after a fit. In addition, they reported the greatest improvement in meeting their patients’ comfort needs.
The smallest change was seen in the question related to the ability to transfer from one surface to another. This may be that the subjects were already functioning close to their maximum capacity or for those with progressive disorders, their disease may have progressed in the intervening time between evaluation and fit and therefore further improvement in transfers was not possible regardless of the seating system and device.
The responses of the matched pairs of individuals with progressive disorders were somewhat similar to our previous study with individuals with non-progressive disorders (Powers, 2013). The greatest change for both groups was seen in reported comfort. The question with the least reported change for those individuals with non-progressive disorders was in accessing public and private transportation. Whereas the question with the least reported change for those individuals with progressive disorders was related to ability to transfer from one surface to another.
For those in this study, there was an average of 83.6 days between the evaluation and the fit. For individuals with progressive disorders, there can be a significant decline in their functional status during that intervening time of this length. Therefore the overall improvements in functioning are especially noteworthy. In the previous study the average length of time between evaluation and fit was 105 days for those without a progressive disorder. This extended period of time between the evaluation and fit contributed to the attrition in both studies. It was difficult to obtain the post-fit evaluations due to subjects being fit at home and the investigators not being notified, intervening illness, or change in home address. In addition some of the devices were denied and therefore no fit occurred.
For both studies, the questions that had the lowest reported average scores on the post-fit were questions 9 and 10, outdoor mobility and accessing public and private transportation. For individuals who use wheeled mobility, community access remains difficult, particularly for individuals that live in areas outside the major metropolitan areas where disability accessible public environments and transportation may be less readily available.
CONCLUSION
Subjects reported a higher level of functioning with their new seating system and device validating the wheelchair prescription. The greatest change from pre to post was reported in the seating system meeting their comfort and health needs. This was consistent with our previous study with individuals with non-progressive disorders The least change in function was reported in ability to transfer from one surface to another. This study provides data supporting the functional improvements that can be gained with properly fit seating systems and devices.
Continuing to provide data related to functional outcomes of individuals prescribed seating and mobility devices will promote improved service delivery and justify appropriate reimbursement for wheeled mobility devices.
REFERENCES
APTA: Functional Limitation Reporting Under Medicare. http://www.apta.org/Payment/Medicare/CodingBilling/FunctionalLimitation/. Accessed January 13, 2014.
Brault M. Americans With Disabilities: 2005. In: Current Population Reports. Washington, DC:U.S. Census Bureau: 2008:70-117. http://www.census.gov/prod/2008pubs/p70-117.pdf. Accessed 1/13/2014.
DiGiovine, CP, Meehl S, Berner T. Outcome Measures as Part of Quality Assurance in a Seating and Mobility Clinic. (2013). Presentation at International Seating Symposium.
Evans S, Frank A, Neophytou C, Souza L. (2007). Older adults' use of, and satisfaction with, electric powered indoor/outdoor wheelchairs. Age and Ageing, 36, 431-435.
Greer N, Brasure M, Wilt T. Wheeled Mobility (Wheelchair) Service Delivery: Scope of the Evidence. Ann Intern Med. (2012). 156:141-146.
Hoenig, Helen, Landerman, L., Shipp, K., George, L. (2003). Activity restriction among wheelchair users. Journal of the American Geriatrics Society, 51, 1244-51.
Kumar A, Schmeler MR, Karmarkar AM, et al. (2013) Test-retest reliability of the functional mobility assessment (FMA): a pilot study. Disability & Rehabilitation: Assistive Technology. 8(3):213-219.
Powers PJ, Fly V., Law M., Lindsley S., Little L., Tomlinson S., Brown RM. (2013) Functional Mobility
Outcomes of Individuals Using Wheelchairs. Platform presentation at International Seating Symposium.
The University of California-Disability Statistics Center (April 2013) Mobility Device Statistics – United States. http://www.disabled-world.com/disability/statistics/mobility-stats.php. Accessed January 13, 2014.
Audio Version PDF Version