Seating Interface Characteristics Through Temperature Description
Julie M. Faieta, B.A., S/OT3; Carmen P. DiGiovine, PhD, ATP/SMS, RET1,2,3; Marcia L. Nahikian-Nelms, PhD, RDN, LD, CNSC, FAND4;Susan White, PhD, RHIA, CHDA5; Matthew Yankie, PT1; DPT,;
1Assistive Technology Center, The Ohio State University Wexner Medical Center;
2Biomedical Engineering Department, The Ohio State University;
3Occupational Therapy Division, The Ohio State University;
4Medical Dietetics Division, The Ohio State University;
5Health Information Management and Systems, The Ohio State University
ABSTRACT
The objective of this pilot study was to describe wheelchair seating characteristics through interface temperature mapping technology. This research was part of a larger study that looked at wheelchair seating quality through pressure mapping, and at the influence of nutrition on risk for pressure ulcer development in the spinal cord injury population. The sample population was comprised of twelve men and women with a spinal cord injury at or below the C5 level; all participants were at least 1 year post injury. The temperature mapping system incorporated a 256 sensor mat and associated software to measure and record temperature data. Seating interface temperatures were measured for each participant’s currently owned cushion and foam cushion. The temperatures across the mats full surface area and within boxed in regions surrounding the ischial tuberosities and sacrum area were recorded at 12 time points. Higher temperatures were seen in 11 out of 12 participants’ current cushion when compared to the foam cushions; however, in 8 cases the total increase in temperature over all time points were greater in the foam cushion when compared to their relative current cushion. The use of a temperature sensing mat was an effective method of characterizing the temperature at the seat cushion / human interface. Future studies should utilize interface temperatures and variations in temperature patterns across surfaces, which can be investigated to determine clinical implications for skin integrity.
BACKGROUND
The prevalence of pressure ulcers within spinal cord injury populations is reported at 27% (Chen, Y., DeVivo, M. J., & Jackson, A. B., 2005). This percentage speaks to the need for further investigation into the risk factors of pressure ulcer development and for improved methods of precisely measuring the effectiveness of intervention strategies within this population (Krause, J. S., & Broderick, L., 2004). There are a variety of wheelchair cushions available to include gel, air, contoured foam, and a hybrid of several materials, all designed to aid in pressure relief; a method for accurately comparing and evaluating types of cushions for an individual’s needs is necessary to confirm a suitable match between patient and cushion type. Previous methods of temperature measurement have used a limited number of sensors whose configuration and placement may have influenced the accuracy of the data collected (Liu, Z., Cascioli, V., Heusch, A. I., & McCarthy, P. W., 2011). Through use of a 16 by 16 inch mat, the researchers in this study were able to consider temperature variations both over time and across the entire seated surface area.
Temperature Relative to Pressure and Nutrition
High pressure points and poor oxygen and nutrition delivery indicated by decreased circulation are all correlated with pressure ulcer incidence, therefore effective methods of measuring these factors, both independently and as they interact, should be investigated (Byrne, D. W., & Salzberg, C. A., 1996). Looking at temperature as it relates directly to wheelchair seating will afford a more complete appraisal of current seating suitability in the spinal cord injury population. this study aims to provide information on methods of collecting more comprehensive and accurate descriptive data, allowing future studies to begin to associate temperature information with data regarding both pressure and nutrition trends recorded for individual participants.
PURPOSE
Our aim in this cross-sectional descriptive study was to establish the following concept:
- Describe seating qualities for multiple wheelchair cushions through interface temperature statistics, measured across time.
METHODS
Subjects
All participants were recruited from a larger study that looked at pressure characteristics of wheelchair seating and at the effect of nutrition on risk of pressure ulcer development within the spinal cord injury population (described above). The convenience sample was comprised of 6 men and 6 women between the ages of 24 and 63 and weighing between 136 and 225 pounds. The eligibility criteria were as follows: the participant must be 18 years of age or older, be at least one year post spinal cord injury, the injury level must be at or below C5, and a wheelchair must be used as the primary method of mobility. All participants gave informed consent prior to participation. All members of the sample population were scored on the Braden Scale to establish current risk for pressure ulcer development, and on the ASIA scale to determine motor and sensory impairment. Participants were also interviewed and given a physical exam to determine their baseline health status.
Temperature Measurement
All temperature measurements took place during a single visit lasing several hours at the Assistive Technology Center, The Ohio State University Wexner Medical Center. An FSA temperature mat enclosing temperature sensors dispersed in a 16 x 16 one inch grid was used for all measurements. The mat was placed either on the participant’s current cushion or a foam cushion. The participants’ current cushions included the following types: Jay Extreme, Comfort Maxx Foam, Jay 2 Deep Contour, ROHO Quatro, Jay Fusion, Jay Easy (with added foam insert), Jay 2, Jay 2 Gel, ROHO Hybrid Air, and Invacare AirFlo; the cushion used for comparison was the Invacare Single Density 16 by 17 inch foam cushion. Each participant was seated on the mat for 10 minutes while seating interface temperature was recorded at 30 seconds, 60 seconds, 90 seconds, and at each subsequent minute mark from 2-10 minutes. All measurements were performed by a trained Physical Therapist.
Temperature Data Analysis
RESULTS
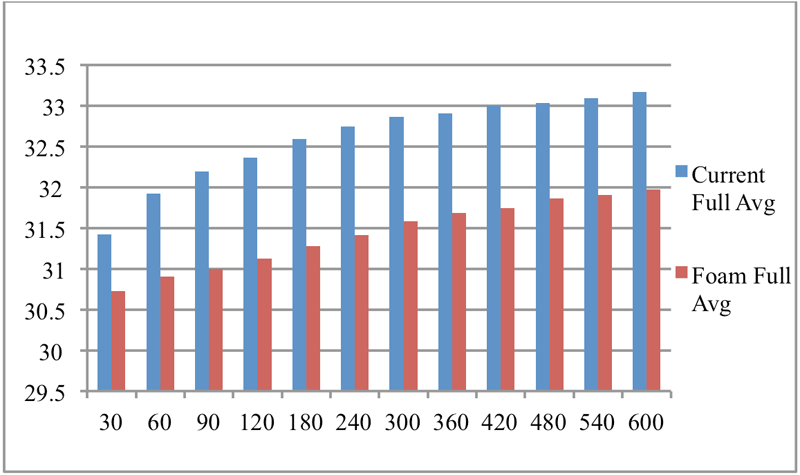
Temperatures for the full mat surface area of all participants’ recorded data were averaged and recorded at each time point for both foam and current cushions. In 11 cases the current cushions had a higher temperature at the 10-minute recording point (Table 1). However, the amount of increase in temperature from 0-10 minutes was greater over the foam cushions for 8 participants when compared to their relative current cushions, and equal between 1 participant’s foam and current cushion.
| Cushion Type | Average Temp at 10 minute Point | Temperature Change from 0-10 minutes (in degrees C) |
|---|---|---|
| #8 Jay Extreme | 33.17 | 1.75 |
| #8 Invacare Single Density Foam | 31.97 | 1.24 |
| #9 Comfort Maxx Foam | 34.27 | 1.07 |
| #9 Invacare Single Density Foam | 32.05 | 0.81 |
| #10 Jay 2 Deep Contour | 32.75 | 1.23 |
| #10 Invacare Single Density Foam | 30.82 | 2.59 |
| #11 ROHO Quatro | 28.81 | 2.17 |
| #11 Invacare Single Density Foam | 28.36 | 2.17 |
| #12 Jay Fusion | 32.08 | 2.01 |
| #12 Invacare Single Density Foam | 29.43 | 1.08 |
| #13 Jay Easy | 31.77 | 1.81 |
| #13 Invacare Single Density Foam | 30.32 | 2.4 |
| #14 Jay 2 | 32.14 | 1.44 |
| #14 Invacare Single Density Foam | 29.71 | 2.75 |
| #15 Jay 2 Gel | 34.23 | 1.7 |
| #15 Invacare Single Density Foam | 30.71 | 2.01 |
| #16 ROHO Hybrid Air | 32.66 | 1.31 |
| #16 Invacare Single Density Foam | 31.34 | 2.73 |
| #17 Invacare AirFlo | 32.75 | 0.76 |
| #17 Invacare Single Density Foam | 30.84 | 1.88 |
| #18 Jay Fusion | 32.71 | .97 |
| #18 Invacare Single Density Foam | 31.78 | 1.89 |
| #19 Roho Quatro Low Profile Seat Cushion | 27.83 | .95 |
| #19 Invacare Single Density Foam | 28.95 | 1.12 |
Discussion
This study found that the use of a temperature sensing mat was an effective method of gathering temperature data in wheelchair cushions. When compared to past methods of data collection, this mat allowed for more comprehensive measurements as a result of the larger area of temperature sensor distribution, and decreased influence on temperature in the sensor area (Cengiz, T. G., & Babalık, F. C.,2007). This study used a ten minute time period to allow the increase in temperature to stabilize. Though the rate of increase did slow over time, a steady state was not reached. In analyzing the temperature increase across the time points, we found that there were variations in which types of cushions showed a greater overall increase in temperature, regardless of baseline temperature (Table 1). Allowing the seat interface to reach a constant temperature may give a better indication of which type of cushion ultimately correlates to higher interface temperatures. In addition, the order of cushion measurement may have had an influence on over all temperature comparisons, specifically, the participants’ current cushions were measured first and so potential residual heat from use may have caused higher overall temperatures. Future studies should consider the order of measurement and the amount of time necessary for the cushions to reach equal base temperatures. Further, research should consider increasing the time period for data collection so that a steady state temperature can be confirmed. Once established, constant interface temperatures and variations in temperature patterns across surfaces can be investigated to determine clinical implications for skin integrity.
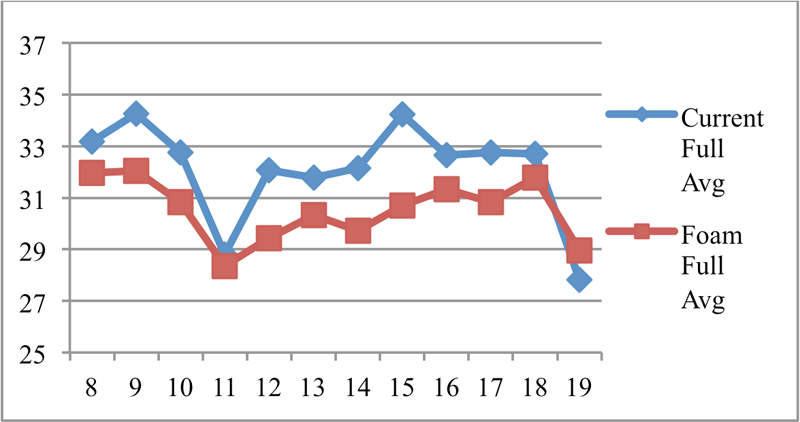
Limitations of this study included a small sample size and a narrow recording period for temperature data collection. A larger sample group may provide additional insight into temperature patterns among cushion types and increase the generalizability of the findings. When the full surface area was averaged at each time point within the ten minute recording span, and the highest temperature among them recorded for each participant, the current cushions maintained a higher maximum temperature across 11 of 12 cases. The differences between cushion types, however, were not uniform among the sample population. The difference between the foam and current cushions average temperatures at the 10 minute point ranged from .45 degrees to 3.52 degrees Celsius (Figure 3). This variation may be related to the current cushion type, the clothing that an individual was wearing, and the unique characteristics of the individual; future research should make additional comparisons between gel, air, and hybrid cushions in order to better understand this inconsistency. Research is needed to explore the potential underlying causes for temperature variations, namely blood flow patterns. Decreased levels of the blood protein albumin is a suspected risk factor of pressure ulcer development and so decreased blood flow and subsequent decrease in nutrition delivery to areas of high pressure in wheel chair seating should be further investigated (Terekeci, H., Kucukardali, Y., Top, C., Onem, Y., Celik, S., & Öktenli, Ç., 2009 ).REFERENCES
Byrne, D. W., & Salzberg, C. A. (1996). Major risk factors for pressure ulcers in the spinal cord disabled. Spinal cord, 34, 255-263.
Cengiz, T. G., & Babalık, F. C. (2007). An on-the-road experiment into the thermal comfort of car seats. Applied Ergonomics, 38(3), 337-347.
Chen, Y., DeVivo, M. J., & Jackson, A. B. (2005). Pressure ulcer prevalence in people with spinal cord injury: age-period-duration effects. Archives of physical medicine and rehabilitation, 86(6), 1208-1213.
Krause, J. S., & Broderick, L. (2004). Patterns of recurrent pressure ulcers after spinal cord injury: identification of risk and protective factors 5 or more years after onset. Archives of physical medicine and rehabilitation, 85(8), 1257-1264.
Liu, Z., Cascioli, V., Heusch, A. I., & McCarthy, P. W. (2011). Studying thermal characteristics of seating materials by recording temperature from 3 positions at the seat-subject interface. Journal of tissue viability, 20(3), 73-80.
Terekeci, H., Kucukardali, Y., Top, C., Onem, Y., Celik, S., & Öktenli, Ç. (2009). Risk assessment study of the pressure ulcers in intensive care unit patients. European journal of internal medicine, 20(4), 394-397.
ACKNOWLEDGEMENTS
We would like to acknowledge Hannah Oakley and Kim Pierpont Division of Medical Dietetics, School of Health and Rehabilitation Sciences, The Ohio State University for their involvement in data collection and analysis. We would also like to recognize the School of Health and Rehabilitation Sciences, The Ohio State University for funding this project