The impact of wheelchair weight distribution and human physiological fitness on over-ground maneuver
Jui-Te Lin, MS, PT, Stephen Sprigle, PhD, PT
School of Applied Physiology, Georgia Institute of Technology, Atlanta, GA
ABSTRACT
The purpose of this study is to identify the relative influence of wheelchair weight distribution and human physiological fitness on the performance of free-wheeling activity. We quantified weight distribution of wheelchair systems with subjects seated. We also evaluated subjects’ fitness by doing a multistage arm-cycling exercise, and measured oxygen consumption to demonstrate how much effort was required for subjects to propel themselves. A coast-down test was further applied to understand the impact of wheelchair weight distribution on overall friction. We found that weight distribution had a greater impact than physiological fitness on propulsion effort. By analyzing our regression model for weight distribution, we noted that subjects using their wheelchairs with greater loading on drive wheels tended to reduce propulsion effort, whereas the influence of physiological fitness was not significant. By examining the friction parameters, we found that loading on drive wheels tended to increase friction in turning but reduce friction in a straight direction. Overall, these study results indicate that the loading on drive wheels is helpful in reducing propulsion effort through changing overall friction in different manners. In clinical application, optimizing weight distribution via axle adjustment or reconfiguring wheelchair designs might benefit users.
BACKGROUND
Compared to ambulating, propelling a wheelchair is less energy efficient [1, 2] . Greater propulsion effort can lead to difficulty in achieving desired speeds, a higher probability of fatigue over long bouts of mobility, and difficulty negotiating inclines. Over time, the accumulation of expended effort can potentially cause injuries in the upper extremities, a complication in MWUs that has been thoroughly studied [3-5].
These issues of mechanical efficiency and effort have motivated a substantial body of research targeting improved wheelchair propulsion at the component level. Such work can be roughly grouped into (1) studies of components and mechanical systems, and (2) studies of biomechanical propulsion pattern and physiological capacity. Studies related to mechanical systems have focused on rolling resistance as a function of the wheelchair [6, 7], the tire design, and material [8-10]. Many other studies of propulsion behaviors have focused on biomechanics [11-13] with respect to various wheelchair configurations, or with respect to exercise training on propulsion capacity [14]. However, these studies do not fully translate to clinically-useful knowledge because they do not reflect the complex interactions among wheelchair components on a systems level. Furthermore, no studies have looked into the relative influence of wheelchair designs and human factors on wheelchair propulsion, especially on daily maneuvers including accelerations, decelerations, and turns [15].
The goal of this study was to understand the impact of wheelchair weight distribution and human physiological fitness on an over-ground maneuver designed to reflect daily activities. This study also addressed how weight distribution would influence overall friction across wheelchair users and designs.
METHOD
Subjects
This study recruited fifteen full-time manual wheelchair users: fourteen subjects with spinal cord injury and one subject with traumatic brain injury. Three subjects had a cervical injury level and twelve subjects had a thoracic injury level. Fourteen subjects were males and one was female. The age ranged from 24 to 58 years old.
Protocol
Subjects made two visits to complete the whole experiment. During the first visit, we quantified the mechanical properties of wheelchairs by measuring system mass, inertia, weight distribution, and friction. To evaluate the performance of wheelchair propulsion, subjects were instructed to finish over-ground maneuvers on both tile and carpet surfaces using their own wheelchairs. During the second visit, subjects completed the multistage submaximal arm exercise for evaluating their physiological fitness. The detail of testing protocols is explained in the following sections.
Instrumentation
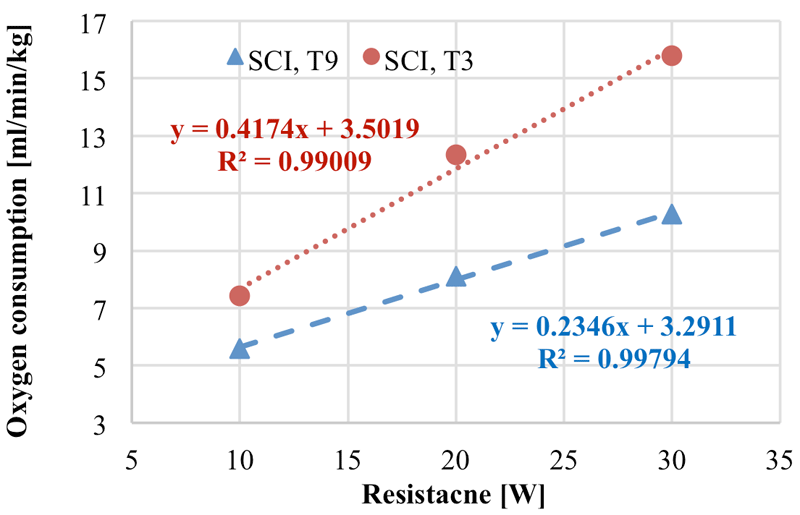
Metabolic system.The propulsion demand is reflected in oxygen consumption (VO2) during over-ground maneuvers. We continuously measured subjects’ VO2 from expired gas using a portable VO2 measurement system (Fitmate Pro, Cosmed, Italy) and represent their aerobic metabolic by VO2 expressed in ml/min·kg during the task. Then we averaged the last minute of steady-state oxygen consumption to represent the propulsion demand for the over-ground maneuver. We also used a metabolic system for evaluating physiological fitness by doing a multistage arm-cycling exercise.
iMachine. Center of mass (kg), rotational moment of inertia (Izz), and weight distribution (%) were measured experimentally using a device called the iMachine [16].
Accelerometers. To measure overall friction, each participant’s wheelchair was instrumented with a data logging system on both sides of drive wheels for measuring wheel rotation rate. The data logging system (MSR 145, Swiss) features a solid-state, triaxle accelerometer with a ±1 g range at its core with a 50 Hz sampling rate.
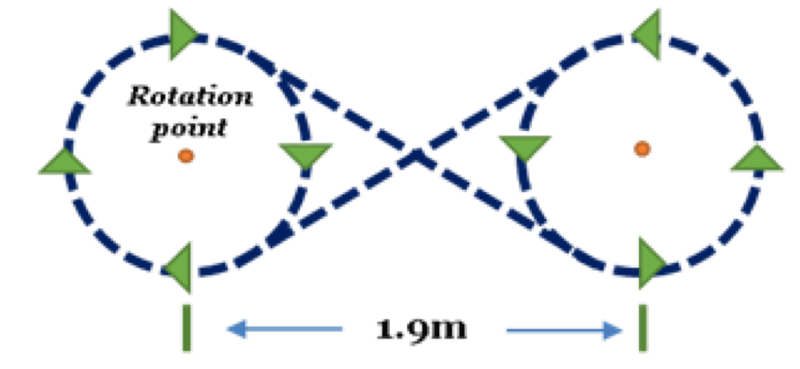
Over-ground maneuver
Data Analysis
Statistics. To determine the combined effect of mechanical and physiological parameters, regression procedures, using weight distribution (%) and physiological fitness (ml/min∙kg∙W) as independent variables, were used to predict the dependent variables, net propulsion effort (ml/min·kg). Nonparametric spearman correlations were furthermore used to understand the relationships among weight distribution and friction parameters (m/s2).
Net propulsion effort. This is a construct that best reflects the net cost of wheelchair propulsion. The measurement quantifies the energy efficiency of transporting a certain wheelchair to complete such work. The greater the effort of propulsion, the less efficient a wheelchair is, for it requires more energy/effort to perform the same task. Since net metabolic effort reflects the actual value of propulsion effort by accounting for the resting metabolic loss during propulsion, we used the net propulsion effort as our dependent variable. The metabolic energy cost (VO2) of the wheelchair maneuver was measured in ml/min·kg.
Weight distribution. By using iMachine, weight distribution was calculated based on the distance between the center of mass and rear axle. The value is represented as the percent (%) loading on the drive wheels.
Frictional parameters. A coast-down protocol was deployed to measure frictional energy loss during straight trajectories and fixed-wheel turns [20]. Decelerations (m/s2) recorded through accelerometers [15] on both wheels were averaged to represent frictional parameters from each direction. Measurements from left and right turns were averaged to provide a single turning value. Post processing of all deceleration values was fed into custom-made software (Matlab 2013, MathWorks, USA). The detail of coast-down protocol and related data processing were published in Lin et al. [20] paper.
RESULTS
Table 1 shows the mechanical and frictional parameters of wheelchair systems and the physiological parameters of wheelchair users.
| Mechanical parameters | Physiological parameters | |||||
|---|---|---|---|---|---|---|
| System mass (kg) | 102.3±20.1 | Net effort_Tile (ml/min∙kg) | 7.1±1.9 | |||
| Rotational inertia (kg∙m2) | 5.5±2.2 | Net effort_Carpet (ml/min∙kg) | 9.5±2.3 | |||
| Weight distribution (%) | 72.3±7.2 | Physiological fitness (ml/min∙kg∙W) | 0.3±0.1 | |||
| Frictional parameters (decelerations) | ||||||
| Tile surface | Carpet surface | |||||
| Straight (m/s2) | Turn (m/s2) | Straight (m/s2) | Turn (m/s2) | |||
| 0.11±0.03 | 0.14±0.04 | 0.20±0.05 | 0.28±0.03 | |||
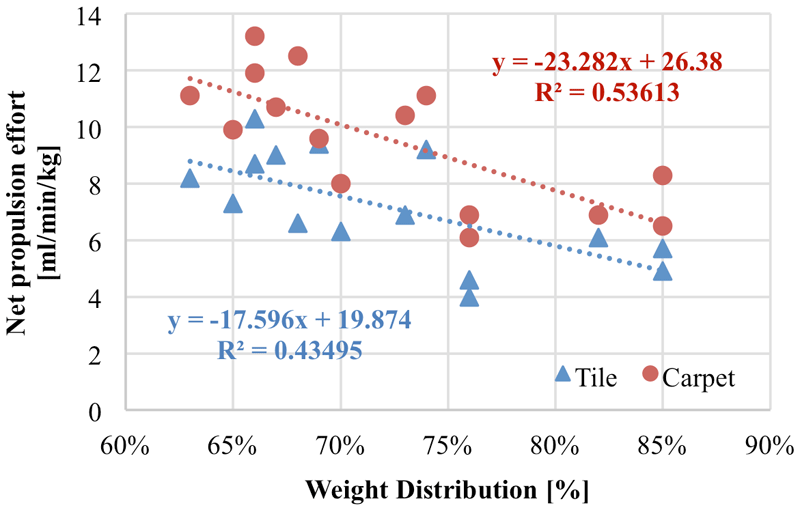
![]() = -0.66, p<0.01) and carpet (
= -0.66, p<0.01) and carpet (![]() = -0.73, p<0.01).
= -0.73, p<0.01).
| Independent variables – Tile surface | |||||
|---|---|---|---|---|---|
| Coefficient | Unstandardized | Standardized | |||
| B | SE | Beta | Sig. | R2 | |
| (constant) | 20.33 | 4.24 | 0.000 | 0.45 | |
| Weight distribution (%) | -17.22 | 5.76 | -0.65 | 0.011 | |
| Physiological fitness (ml/min∙kg∙W) | -2.46 | 4.52 | -0.12 | 0.596 | |
| Independent variables – Carpet surface | |||||
| Coefficient | Unstandardized | Standardized | |||
| B | SE | Beta | Sig. | R2 | |
| (constant) | 25.54 | 4.47 | 0.000 | 0.57 | |
| Weight distribution (%) | -23.98 | 6.08 | -0.75 | 0.002 | |
| Physiological fitness (ml/min∙kg∙W) | 4.51 | 4.77 | 0.18 | 0.363 | |
| Weight distribution: % loading on drive wheels; SE: standard error; Sig. significance | |||||
According to the results from the zero-order nonparametric corrections (Spearman’s rho) between weight distribution and frictional parameters, we found that loading on drive wheels had a significantly negative correlation with straight decelerations on carpet (![]() s= -0.63, p<0.05), but significantly positive correlation with turning decelerations on tile (
s= -0.63, p<0.05), but significantly positive correlation with turning decelerations on tile (![]() s= 0.73, p<0.01).
s= 0.73, p<0.01).
DISCUSSION
The results of the present study indicate that the weight distribution of the wheelchair system had a greater influence on propulsion effort than physiological fitness of the subject. Although the subjects’ injury type and level would influence their functional outcome [21], our recruited subjects did not show a difficulty in completing the propulsion tasks. Two possible reasons are that 1) our propulsion tasks, which simulate daily maneuvers, reflect moderate exercise intensity and/or 2) all subjects are full-time, active, and experienced manual wheelchair users. In either case, the performance of free-wheeling maneuvers will be less influenced by physiological fitness than by propulsion skills and wheelchair configurations.
Because there are many commercial designs and configurations of wheelchairs, this study measured system weight distribution as a systematic approach to quantify the mechanical properties of wheelchairs [22]. According to our regression models on both terrains, we found that subjects using wheelchairs with more loading on drive wheels tended to reduce propulsion effort. By looking into the correlation between weight distribution and decelerations, we further found that weight distribution influences the overall friction in both maneuver directions but in a different manner. In detail, having a greater loading on the drive wheels, the wheelchair would increase deceleration in turning trajectory on a tile surface, but reduce deceleration in a straight trajectory on a carpet surface. The results are consistent with the Lin et al. coast-down study using a ISO dummy with four wheelchair configurations [20].
In our over-ground maneuver, subjects need to decelerate wheelchairs in the turning portion, but accelerate wheelchairs in the straight-line portion. Therefore, during freewheeling maneuvers, greater turning friction may be helpful for users to reduce their propulsion effect by facilitating deceleration, whereas lesser straight friction may be helpful for users to reduce their propulsion effect during acceleration. In clinical application, weight distribution can be adjusted through moving wheel axle positions or changing wheelchair frame types [20]. For example, moving the wheel axle positon forward would increase loading on drive wheels.
CONCLUSION
This study design provides a systematic approach to quantifying the mechanical properties of the wheelchair system. The multi-stage arm exercise also provides a valid and convenient approach to evaluate the aerobic fitness of wheelchair users. By designing a repeatable maneuver endowed with representative acceleration, stops, and turns, for the first time this study provides a direct approach to understand the relative influence of wheelchair designs and human physiological fitness on over-ground maneuvers. Due to the limited sample size and injury types, our subjects may have a homogeneous characteristic of their functional capacity or wheelchair designs. In future studies, we will increase the variance of our recruitment and wheelchair configurations.
Knowledge of how weight distribution and physiological fitness impact wheelchair over-ground maneuvers is advantageous for clinicians and users when selecting or modifying a manual wheelchair.
REFERENCES
18. Franklin, B.A., Exercise testing, training and arm ergometry. Sports Med, 1985. 2(2): p. 100-19.
22. Sprigle, S. and M. Huang, Impact of Mass and Weight Distribution on Manual Wheelchair Propulsion Torque. Assist Technol, 2015. 27(4): p. 226-35.ACKNOWLEDGEMENTS
This work was completed as part of the Mobility RERC, which is funded by the National Institute on Disability, Independent Living and Rehabilitation Research of the U.S. Department of Health and Human Services under grant number 90RE5000-01-00. The opinions contained in this paper are those of the grantee and do not necessarily reflect those of the U.S. Department of Health and Human Services.