Haesung Jeong*, Hyungi Jeong*, Kong Borasy*,
Kyu-Sung Kim***, Sangmin Lee**, Jangwoo Kwon*
Department of Computer Engineering, Inha University, Korea*
Department of Electronic Engineering, Inha University, Korea**
Department of Otorhinolaryngology, Inha University Hospital, Korea***
Abstract
A brain-computer interface (BCI) is a technology that uses electrical signals generated from the human brain to help people who have physical disabilities overcome their physical limitations. BCI technology has been used in various areas. BCI uses electroencephalography (EEG) signals the waveform and intensity of which are different based on the characteristics of each person. The accuracy of the generated signal can also be improved through training. Thus, this study proposes EEG signal intensification training software to generate a classification model that uses the user's own EEG signals. In addition, EEG signal generation can be trained through our software.
Introduction
A brain-computer interface (BCI) is a technological interface by which commands can be transferred to a computer or other machine by means of electrical signals produced from the human brain [1]. Several studies have been conducted on the accuracy of BCI systems. Xu et al. employed linear discriminant analysis as a classification algorithm after EEG signals generated from the motor imaginary of both hands were measured using wavelet coefficients. Costantimi et al. utilized a fast Fourier transform at the EEG μ-band to extract the mean power spectrum by employing a support vector machine (SVM) as a classification algorithm [3]. However, these studies assumed that the signals were fixed. Therefore, they are not suitable for signals whose intensity is weak.
The EEG signals have different patterns and intensities based on the characteristics of people. Therefore, determining the intentions of all persons by means of a single model created as a classification algorithm is not possible. In addition, the BCI system may not be suitable if the strength and intensity of the generated EEG signal is weak. Thus, a classification model based on user EEG signals should be used for a BCI system. In addition, EEG signal intensification training is necessary to improve the correct classification rate when a user's own EEG signals are applied to the BCI system [4].
Accordingly, this study proposes training software to improve the accuracy of EEG signals generated from users. The proposed software performs EEG signal accuracy training by utilizing signal differences that arise when a user has logical and emotional imaginary.
Proposed method
In general, EEG signals have different characteristics based on their bands. The amplitude of α wave (8-13 Hz) increases during relaxed states of mind, whereas the amplitude of β waves (13-30 Hz) increases during conscious activities while awake [5].
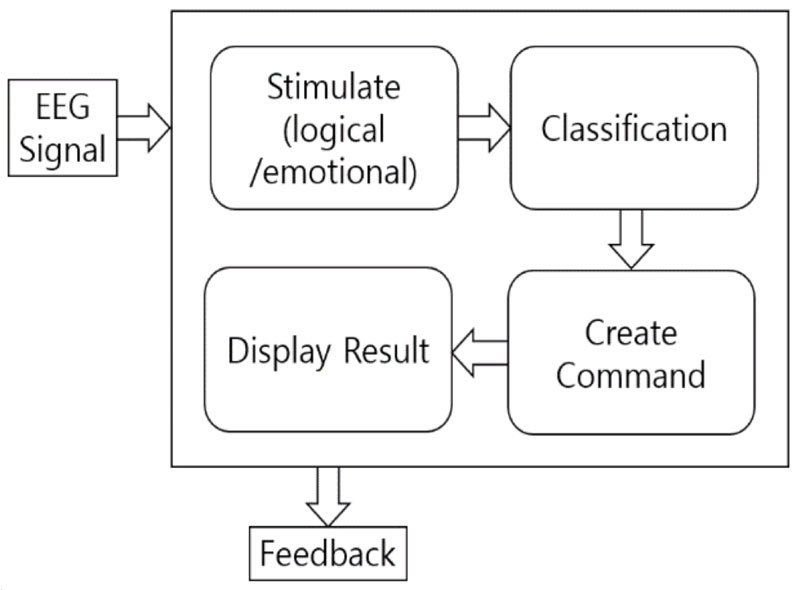
In this study, training software is implemented to improve EEG signal accuracy, as shown in the flow of the operation in Fig. 1, in which different characteristics are considered based on signal band.
First, a user measures his or her own EEG signal to measure the accuracy. The user then gazes at photos to stimulate senses to continue the training. The photos are divided into logical and emotion-stimulating photos. The logical photos include mathematical formulas, thus requiring logical thinking. Here, the amplitude of user's β waves is expected to increase. By contrast, the emotional photos present comfort-inducing images such as of seas or mountains. With these emotional photos, the amplitude of the user's α waves is expected to increase as the user relaxes.
Based on the aforementioned points, at least two control commands can be generated. Examples of command generation are presented in Table 1.
| Imaginary 1 | Imaginary 2 | Control command |
| Logical | Emotional | UP |
| Logical | Logical | DOWN |
| Emotional | Emotional | LEFT |
| Emotional | Logical | RIGHT |
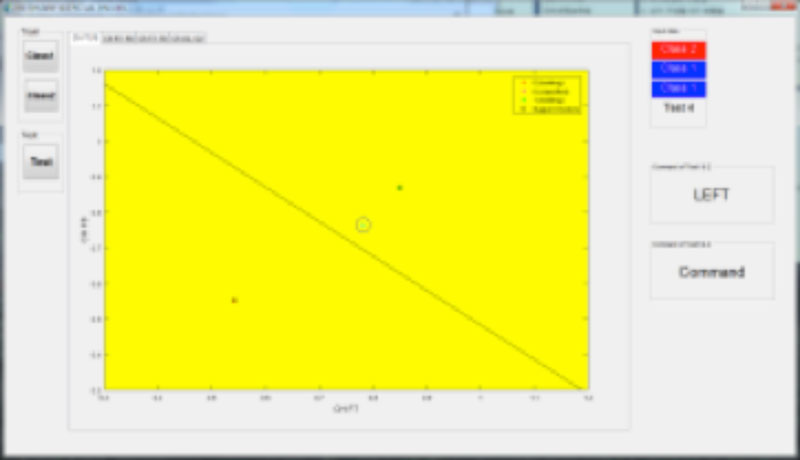
The control commands produced in the aforementioned can be displayed on the screen, as shown in Fig. 2. The red box on the right side is the result indicating that the inputted EEG signal corresponds to logical information processing. By contrast, the blue box refers to emotional information processing. Based on the results, the LEFT command is generated as shown in the figure.
-
Experiment and results
Experimental environment and data
Preprocessing and extraction of feature information
The noise in the measured EEG signals was removed by applying the ICA algorithm, and the signals were classified into μ band (8-12 Hz) and β band (13-30 Hz) through the band pass filter. Feature information was then extracted. Feature information, which is defined by the root-mean-square (RMS) in the following equation, was extracted, and the length of the time-window was set to 40 ms to conduct pattern recognition. Note that x in (1) refers to the measured EEG signal, i refers to the order of the sample, and N refers to the number of samples.
(1)
Next, the accuracy of the extracted feature information was verified by applying the SVM classification algorithm.
Training process
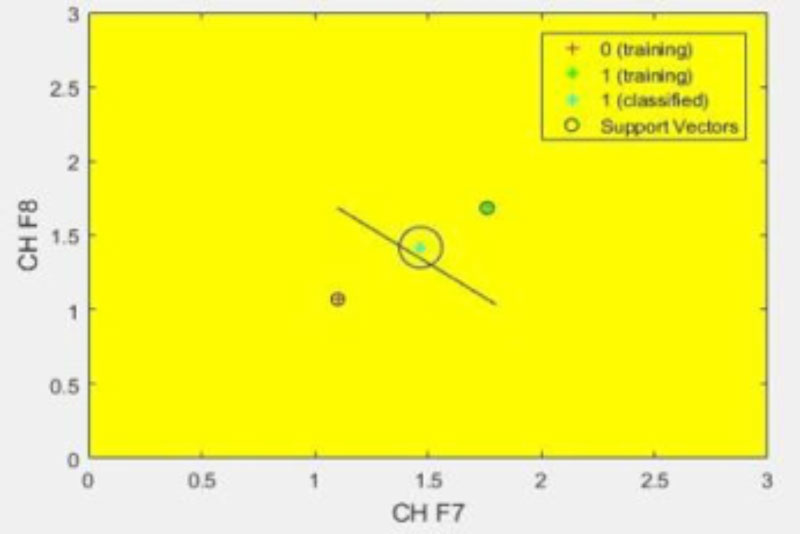
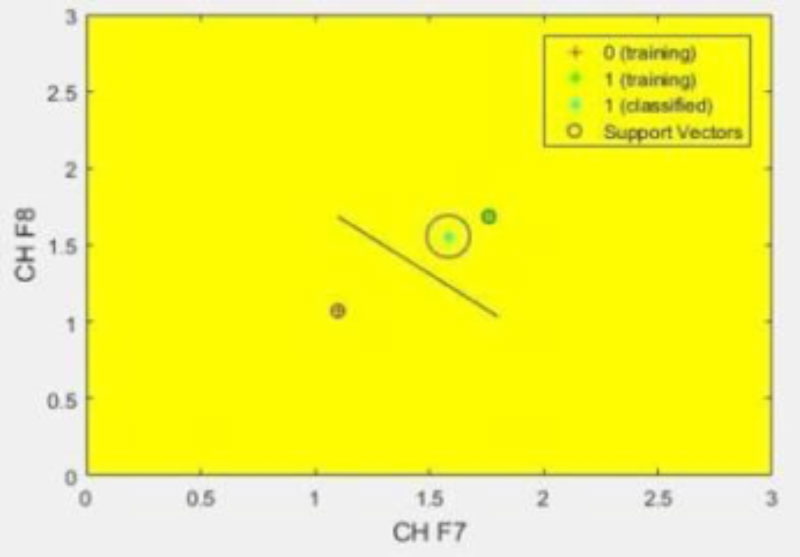
Fig. 3 shows the EEG signal data input related to emotional information processing during the testing phase. The figure shows that this emotional information processing data are closer to the boundary of logical information processing. This means that more emotional photos were presented to the participant to induce more emotional information processing, thereby improving EEG signal accuracy. As a result of iterative experiments, the emotional information processing data moved farther from the boundary of logical information processing, as shown in Fig. 4
After sufficient training was conducted by the participants, EEG signal measurements for the participants were performed three times. The accuracy of the measured data was compared based on RMS results, which included feature information extracted from the data prior to training.
Conclusion
This study developed training software to improve EEG signal accuracy. The developed software can verify the accuracy of EEG signals based on the differences in EEG signals between emotional and logical information processing types.
Furthermore, users can train themselves to improve EEG signal accuracy and further facilitate the use of software and devices using the BCI system. Users can also determine whether EEG signals measured that they themselves have measured can create preferred control commands, which can be accomplished by easily checking the results.
Participants in this study were able to see the improvements in accuracy after completing EEG signal accuracy improvement training using the training software.
By using the EEG signal intensification software developed in the present study, people with physical disabilities may use software or devices in the BCI system efficiently, thereby overcoming their physical limitations.References
Journal article:
[1] J. Wolpaw, “Brain Computer Interface Technology: A Review of the First International Meeting,”IEEE Trans. No Rehabilitation Engineering, Vol. 8, No.2, pp.164-173, 2000.
[2] B. G. Xu and A. G. Song,“Pattern recognition of motor imagery EEG using wavelet transform”, J. Biomedical Science and Engineering, Vol. 1, pp.
[3] G. Costantini, M. Todisco, D. Casali, M. Carota, G. Saggio, L. Bianchi, M. Abbafati, and L.R. Quitadamo, “SVM Classification of EEG Signals for Brain Computer Interface”, in Proc. WIRN, pp. 229-233, 2009. 492-501, 2013.
[4] G. Dornhege, “Increasing Information Transfer Rates for Brain-Computer Interfacing” PhD thesis, University of Potsdam, 2006.
[5] W. J. Ray and H. W. Cole, “EEG alpha activity reflects attentional demands, and beta activity reflects emotional and cognitive processes”, Science 10 May 1985: Vol. 228, Issue 4700, pp. 750-752
Acknowledgments
This research was supported by the Basic Science Research Program through the National Research Foundation of Korea (NRF) funded by the Ministry of Education (2010-0020163).