Heidi Horstmann Koester, PhD1 and Rich Simpson, PhD, ATP2
1Koester Performance Research, Ann Arbor MI and 2Duquesne University, Pittsburgh PA
ABSTRACT
This study measured user performance of the Switch Test within Scanning Wizard software for 17 people who use switches in their daily life as well as 10 unimpaired control subjects. The purpose was to gain a better understanding of expected performance and the basic psychometric qualities of the test. For the 1-hit Switch task, which requires pressing then releasing a switch in response to a visual prompt, trial time for unimpaired controls averaged 0.48 seconds (95% CI of [0.39, 0.58]), as compared to 1.29s ([1.02, 1.57]) for switch users. Similarly, the overall difficulty score for the test was much lower for the unimpaired controls, averaging 2.34 vs. 10.14 for switch users. Test-retest reliability of trial time was measured for the control subjects, with an ICC of .955 and |% difference| of 8.27%. These results suggest that the Switch Test metrics are reasonably sensitive to true differences in switch skill, and that the test can be fairly administered as a measure of switch skill without orientation or significant practice.
BACKGROUND AND PURPOSE
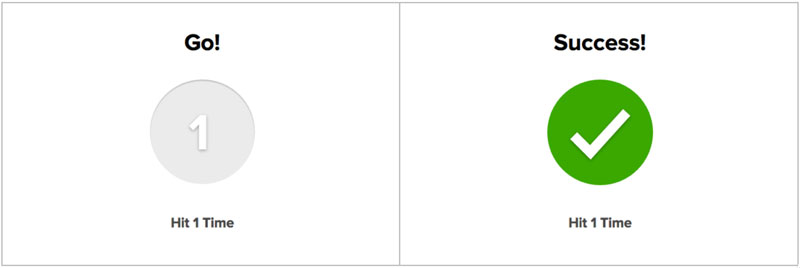
The Switch Test is a task within Scanning Wizard. It checks basic switch skill by measuring the speed and accuracy of responses to an onscreen prompt. Fig 1a shows the prompt for a 1-hit trial. When the prompt appears, the user presses and releases the switch, and sees the response shown in Fig 1b. After the 1-hit trials, a series of 2-hit and 3-hit trials are then presented (showing 2 or 3 circles in the prompt).
Research Questions
- On an initial Switch Test, how well do people do? How does the performance of novice users without impairments compare to that of experienced single-switch users?
- How does performance on the initial Switch Test compare to a repeat Switch Test?
- How many Switch Test trials are necessary?
METHODS
Participants
Three groups of subjects participated:
- Unimpaired Controls (UC): 10 individuals with no motor impairments and no particular experience with assistive technology switches.
- Switch Users 1 (Sw1): 8 individuals who use single switch access to computers and communication systems. Characteristics of this group can be found in [2].
- Switch Users 2 (Sw2): 9 individuals who use single switch access to computers and communication systems.
Procedure
All subjects provided informed consent. Subjects in the UC Group performed the Switch Test twice in a single session. Each test had 30 trials: three phases with 10 trials each of 1-, 2-, and 3-hit responses. Sw1 subjects completed the same 30-trial Switch Test once. Sw2 subjects performed one revised Switch Test of 24 trials, 8 in each phase. UC subjects used a 2.5” diameter switch with their hand. Switch users used their own switch in their preferred location.
Dependent Variables
The Switch Test collects and reports a variety of performance measures. For this study, we focused on the following four dependent variables:
- Average trial time: the time from when the prompt appears until the user responds by hitting the switch for the required number of hits (1, 2, or 3).
- Difficulty score: an index of difficulty calculated by adding the average trial time, the standard deviation of trial time, and the average extra hits for each phase of the Switch Test.
- Initial response time: time from when the prompt appears until the user depresses the switch.
- Press duration: time from when the user depresses the switch until the user releases it.
Data Analysis
For each dependent variable, we calculated the mean, standard deviation (SD), and 95% confidence intervals (CI) of the mean. Group comparisons were made by comparing the confidence intervals.
Test-retest reliability analysis was conducted only for the UC Group, since they were the only group to perform the Switch Test twice. For the variables of average trial time and difficulty score, we computed the absolute value of the percent difference between the first and second test as well as the intra-class correlation coefficient for absolute agreement (ICC).
To examine the sensitivity of the results to the number of trials in each phase, we calculated average trial time and difficulty score based on the first 6, 8, and 10 trials in each phase, for the UC and Sw1 groups. To determine whether the number of trials affected the results, we performed Mixed Model analyses with number of trials as the within-subjects factor and subject as the between-subjects factor.
RESULTS
Performance on Initial Switch Test
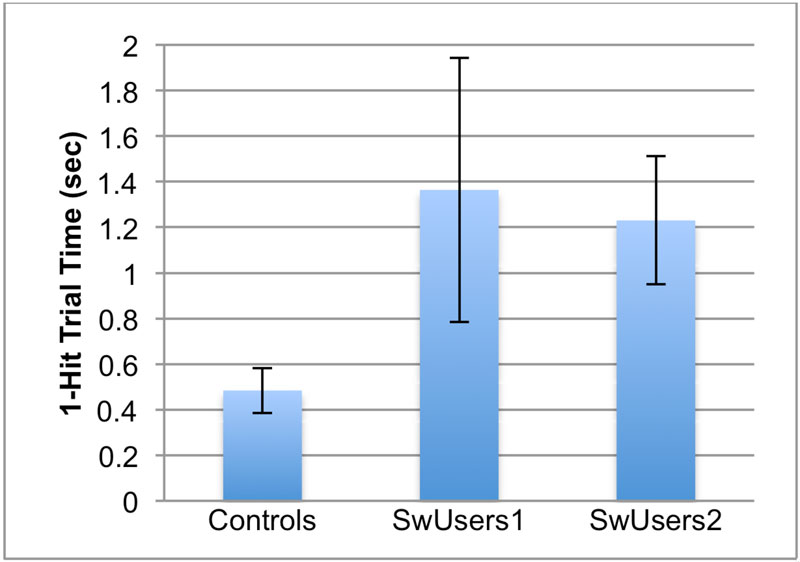
Fig 2 shows the average trial time for 1-hit trials, for each subject group. Unimpaired controls took an average of .48 seconds (SD=.14, 95% CI of [.39, .58]) to complete each 1-hit trial, as compared to 1.29s (SD=.53, [1.02, 1.57]) across both switch user groups. Across the 17 switch users, the average trial time ranged from a minimum of .51s to a maximum of 2.32s.
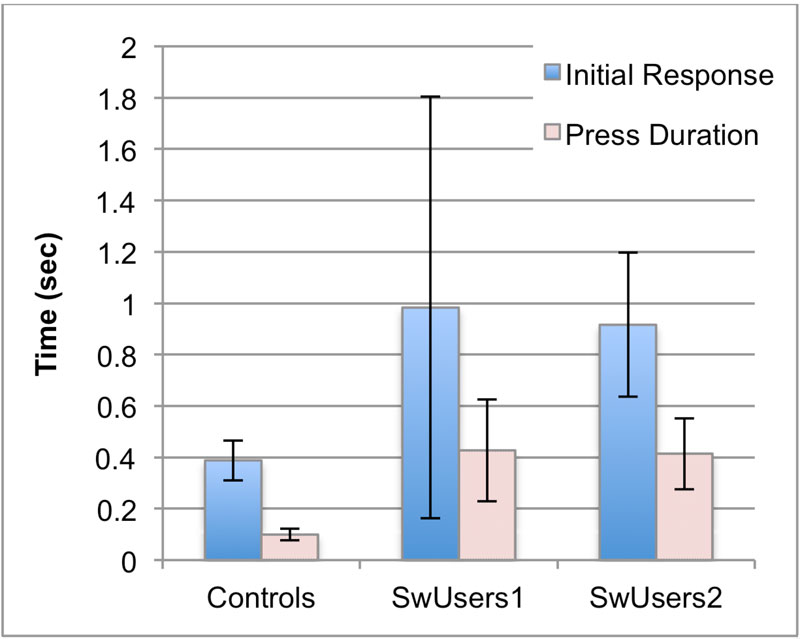
Fig 3 breaks the overall trial time into its components of initial response and press duration. Control subjects took an average of 0.39s to respond to the prompt (SD=.11), and held the switch down for an average of 0.10 seconds (SD=.03). Taken together, the switch users took an average of 0.95s to respond to the prompt (SD=.70), and held the switch down for an average of 0.42 seconds (SD=.20).
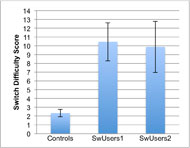
Fig 4 shows the average difficulty score from the full Switch Test for each subject group. Controls averaged 2.34 (SD=.60, [1.91, 2.77]). This is well within the Switch Test’s ‘green zone’ (below 10) indicating successful switch use. Switch users averaged 10.14 (SD=3.19, [8.50, 11.78]), across both groups, ranging widely from 2.22 to 22.77.
Test-retest Reliability
For the UC group, the ICCs for absolute agreement were 0.96 for average trial time and 0.91 for difficulty score, indicating excellent test-retest reliability [3]. The absolute value of percent difference averaged 8.27% for average trial time and 10.78% for difficulty score.
The average trial time and difficulty score were both remarkably stable whether 10, 8, or 6 trials were used in the test. For both the UC and Sw1 groups, these metrics varied by only 1 or 2% for different numbers of trials, and there was no statistical significance for the effect of number of trials.
DISCUSSION
On an initial Switch Test, subjects without physical impairments can press and release their switch in about 0.5 seconds. This provides a rough benchmark for what to expect when there are no impairments with respect to switch activation. Among the 17 switch users, one individual attained this average, at 0.51s, and three others clocked in below 1s. But in general, the switch users were substantially slower than the control group. This pattern was also observed in the metrics of initial response time, press duration, and difficulty score.
With respect to test-retest reliability, this analysis suggests that the Switch Test provides stable results with test repetition. While this was only examined for the UC group, it seems likely that it could also hold for actual switch users, except for those whose switch hit ability fatigues within a very short time. The encouraging test-retest reliability is consistent with what we found with a similar switch test within our Compass software [4].
The finding that 6 trials per phase yields the same information as 8 or 10 trials per phase informed a minor revision to the Switch Test within Scanning Wizard. We reduced the number of trials from 10 to 8, shaving 20% of the trials off the test. While the statistics suggest that we could go even further to 6 trials, that felt a little too sparse, especially for cases where users only complete a single phase of the test.
CONCLUSION
These results suggest that the Switch Test metrics are reasonably sensitive to true differences in switch skill, and that the test can be fairly administered as a measure of switch skill without orientation or significant practice. Thus it provides a valid component of the Scanning Wizard software, for the purpose of providing users and practitioners with insight regarding their switch skill and the suitability of their switch setup.
REFERENCES
1. Scanning Wizard software. (2017). Available at https://scanningwizard.com.
2. Koester H, Simpson R. (2014). A Method for Enhancing Text Entry Rate with Single-switch Scanning. JRRD, 51(6): 995-1012.
3. Hallgren K. (2012). Computing Inter-Rater Reliability for Observational Data: An Overview and Tutorial. Tutor Quant Methods Psychol, 8(1): 23-34. www.ncbi.nlm.nih.gov/pmc/articles/PMC3402032/
4. Koester H, LoPresti E, Simpson R. (2007). Reliability and Validity of Compass Software for Access Assessment. Proc of RESNA 2007 Conference, Phoenix, AZ. Available at kpronline.com/pubs.php.