Ting Zhang1, Juan P. Wachs1, Bradley S. Duerstock1, 2
School of Industrial Engineering1, Weldon School of Biomedical Engineering2
Purdue UniversityAbstract
An increasing number of computer interfaces have been developed to assist blind or visually impaired individuals to perceive or understand the content of digital images. However, there are a few studies focusing on increasing the efficiency and accuracy of image perception using different computer interface designs. This paper investigated two design factors discussed in previous research: single/bimanual interaction, and vertical/ horizontal image exploration. We developed three candidate systems by alternating the two factors. Pair-wised comparisons were made among these alternatives based on experiments with human subjects. Horizontal image exploration showed better performance than the vertical alternative. However, more study is needed to investigate the application of bimanual interaction.
Introduction
Traditional image presentations for the blind or visually impaired (BVI) individuals, like braille and tactile graphics, are printed on physical media like paper that has limitations to convey complex visual information in real-time (Csapó, Wersényi, Nagy, & Stockman, 2015).
We proposed a real-time multimodal image perception system that conveys multiple image features through haptic, vibration and sounds. The experimental results indicated its advantages in accuracy over traditional tactile paper. However, it required more time. During this study, the vertical placement of images and using only one hand were the two most frequently mentioned factors for possibly requiring more time by participants (Zhang, Duerstock, & Wachs, 2017).
Based on the natural methods of how BVI people understand tactile images laid on a desk, horizontal orientation of the image for haptic perception seemed more intuitive for users compared with vertical image orientation (Kim, Ren, Choi, & Tan, 2016).
In addition, participants indicated a loss of reference point when using single-hand interaction. Experiments using tactile paper indicated better performance when users can use both of their hands. While interpreting tactile images, BVI people can use one hand as the reference point, while the other hand exploring the image (Buzzi, Buzzi, Leporini, & Senette, 2015).
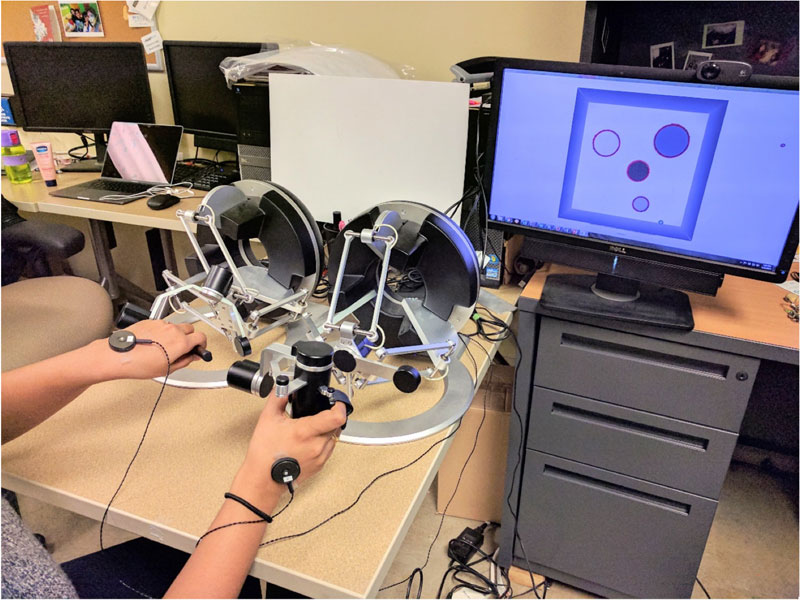
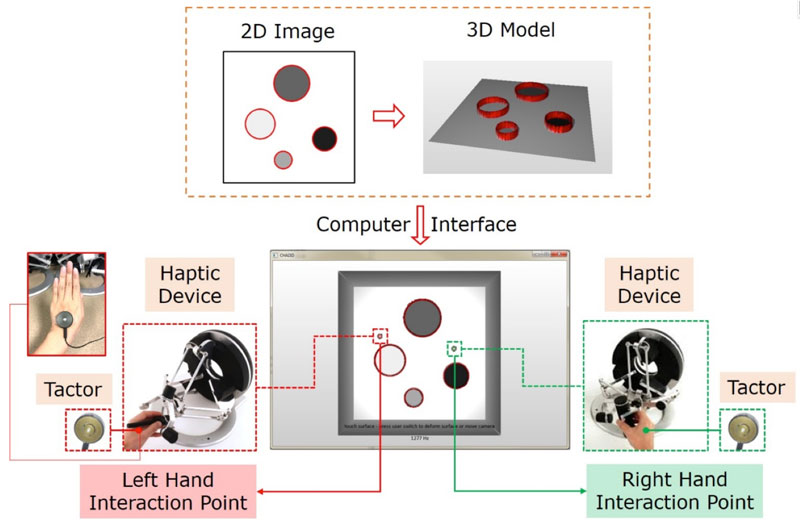
Therefore, in this study, a bimanual system with horizontally placed images was developed (Figure 1). We compared it with two altered systems, one with only one-hand interaction and a horizontal image placement, while the other with bimanual interaction but a vertically displayed image. Experimental results indicated that horizontal placement appears to be more efficient and accurate over vertical alignment. However, more research is required to facsimile bimanual perception of tactile images using a bimanual haptic interaction approach.
Methods
This paper evaluated the proposed multi-point image perception system with comparisons of two altered versions. Each altered system modified one factor mentioned above, while keeping the other one fixed. System I use one-hand interaction with a horizontal image placement. System II is a bimanual interface with a vertically displayed image. Table 1 summarizes the specifications of all three systems.
| System | Specifications | |
| Number of Interaction Points | Image Display Direction | |
| System I | 1 | Horizontal |
| System II | 2 | Vertical |
| Proposed System (III) | 2 | Horizontal |
System Architecture
Task Description
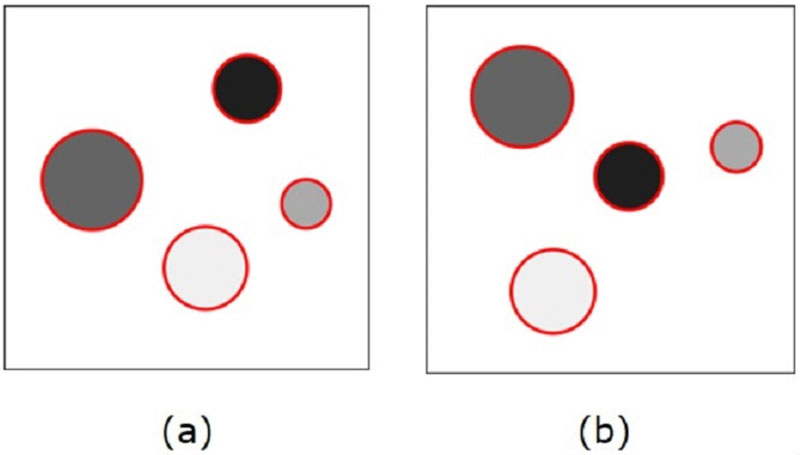
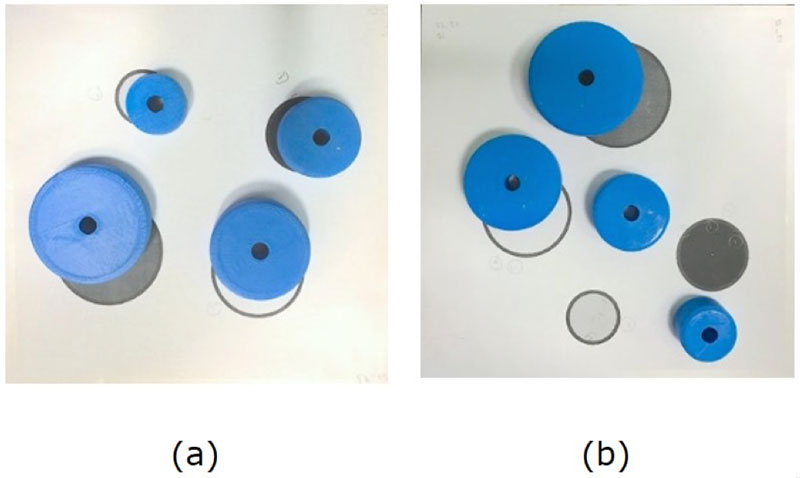
Figure 3 shows examples of the test images. There are four circles within the images of varying sizes and intensities. The participants’ task was to explore the image, perceive the locations of the different-sized circles and then replicate their positions image by placing corresponding plastic cylinders on a paper (Afonso et al., 2010). Figure 5 presents examples of the replicated image during testing.
Performance Metrics
The error rate of size ranking and the distance between circle centers on the image and cylinder centers on the replicated image are the two metrics for accuracy.
Participants
6 blindfolded graduate students, including 3 males and 3 females, were recruited to collect preliminary data.
Procedure
Each subject tested with all three systems. The order of testing each system is randomized to decrease the learning effect. The procedure for each system was the same. At first, the subject had a practice trial to learn and get familiar with both the system and the task. After this trial, the subject started with the first test image by first ranking the sizes of the circles, and then physically place the cylinders on a piece of paper to replicate the test image. The subject can get back to the tested system during the task if desired. Participants were blindfolded during all test phases. The experimenter then took a picture of the replicated image and started the next test image for the subject.
Two test images were used to evaluate each system. One with dispersed placement (Figure 3(a)), the other one with clustered placement (Figure 3(b)). Participants used different images for each system.
After the trials for all systems, participants answered a
Results
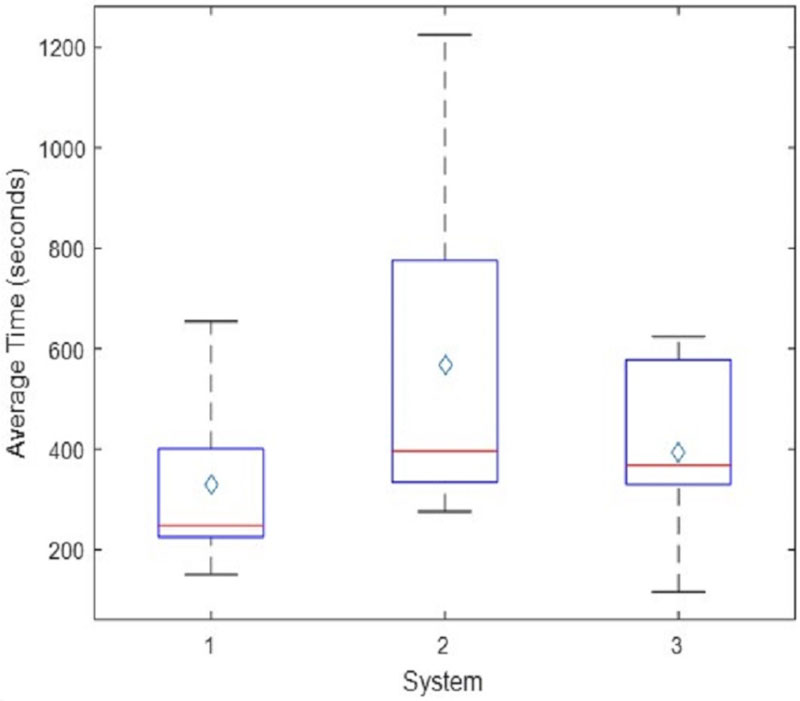
Instead of using an ANOVA test for all three systems, pair-wised comparisons (t-test) were made among the three tested systems, so that the effect of single/double-point interaction and orientation of images can be analyzed individually.
Task Completion Time
Comparing between system I and III (figure 4), which only differ in the number of interaction points, system I with one interaction point took slightly less time than system III with no statistically significant difference (p-value=0.29). Comparing system II and system III, which differ in the image orientation, the horizontal display (system III) indicated significant smaller average task completion time than the vertical one (system II) (374.88<567.83).
Accuracy
All subjects found most of the circle size rankings correctly, therefore, to compare the accuracies between different systems, we focused on how they replicated their mental images. There are four circles on the image. The mean and variance of these four distances were considered as the metrics. A uniform off-center placement as demonstrated in Figure 5(a) indicated a better understanding of the relative positions among all four circles as opposed to a skewed placement showed in Figure 5(b).
Discussion
The results did not show significant differences between one-hand and two-hand interaction regarding both efficiency and accuracy. However, most subjects felt the one-hand system was easier to use than the bimanual approach. Participants felt the bimanual system can help them locate and compare the circles faster, however, this system caused confusion and affected subject performance due to the limitation of the proposed haptic device system. All participants reported confusion about forming refeence frames for both hands. Using the haptic devices, each hand has its own reference frame, which means the positions of two interaction points were not the same as the physical positions of two hands. For example, when the two interaction points both residents at the upper left corner of the image, instead of touching each other, the subject’s two hands are at the upper left position of each device’s working space, which can be several centimeters apart from each other. Also, when the two interaction points are crossed over in the image space, the subject’s two hands are not crossed over. One possible way to clear the confusion about reference frames is to integrate the separate reference frames into a uniform one by building extension handles for both haptic devices, so that the physical positions of both hands are the same as the two interaction points on the image.
Regarding image orientation, experimental performance results corroborated that participants preferred horizontal image orientation to a vertical one.
Conclusion
To investigate the effect of single/bimanual interaction and image orientation, this study compares three systems using a control variant method. Horizontal image exploration resulted in better performance than vertically oriented image perception. This may likely be due to a more intuitive cognitive. Future work is needed to provide effective bimanual interaction using haptic controllers.
References
Afonso, A., Blum, A., Katz, B. F. G., Tarroux, P., Borst, G., & Denis, M. (2010). Structural properties of spatial representations in blind people: Scanning images constructed from haptic exploration or from locomotion in a 3-D audio virtual environment. Memory & Cognition, 38(5), 591–604.
Buzzi, M. C., Buzzi, M., Leporini, B., & Senette, C. (2015). Playing with Geometry: A Multimodal Android App for Blind Children. In Proceedings of the 11th Biannual Conference on Italian SIGCHI Chapter (pp. 134–137). New York, NY, USA: ACM.
Csapó, Á., Wersényi, G., Nagy, H., & Stockman, T. (2015). A survey of assistive technologies and applications for blind users on mobile platforms: a review and foundation for research. Journal on Multimodal User Interfaces, 9(4), 275–286.
Dewhurst, D. (2009). Accessing Audiotactile Images with HFVE Silooet. In Haptic and Audio Interaction Design (pp. 61–70). Springer, Berlin, Heidelberg.
Horvath, S., Galeotti, J., Wu, B., Klatzky, R., Siegel, M., & Stetten, G. (2014). FingerSight: Fingertip Haptic Sensing of the Visual Environment. IEEE Journal of Translational Engineering in Health and Medicine, 2, 1–9.
Kim, K., Ren, X., Choi, S., & Tan, H. Z. (2016). Assisting people with visual impairments in aiming at a target on a large wall-mounted display. International Journal of Human-Computer Studies, 86, 109–120.
Zhang, T., Duerstock, B. S., & Wachs, J. P. (2017). Multimodal Perception of Histological Images for Persons Who Are Blind or Visually Impaired. ACM Trans. Access. Comput., 9(3), 7:1–7:27.Acknowledgements
We are grateful for the assistance of the Center for Paralysis Research at Purdue University. This research was made possible through the Regenstrief Center for Healthcare Engineering of the Discovery Park.