Use Of Wheelmill System For Peak Vo2 Measurement For Manual Wheelchair Users
Joseph Klaesner, Kelly Taylor, Susan Tucker, W. Todd Cade, and Kerri Morgan
Program in Physical Therapy and Program in Occupational Therapy,
Washington University in St. Louis
Abstract
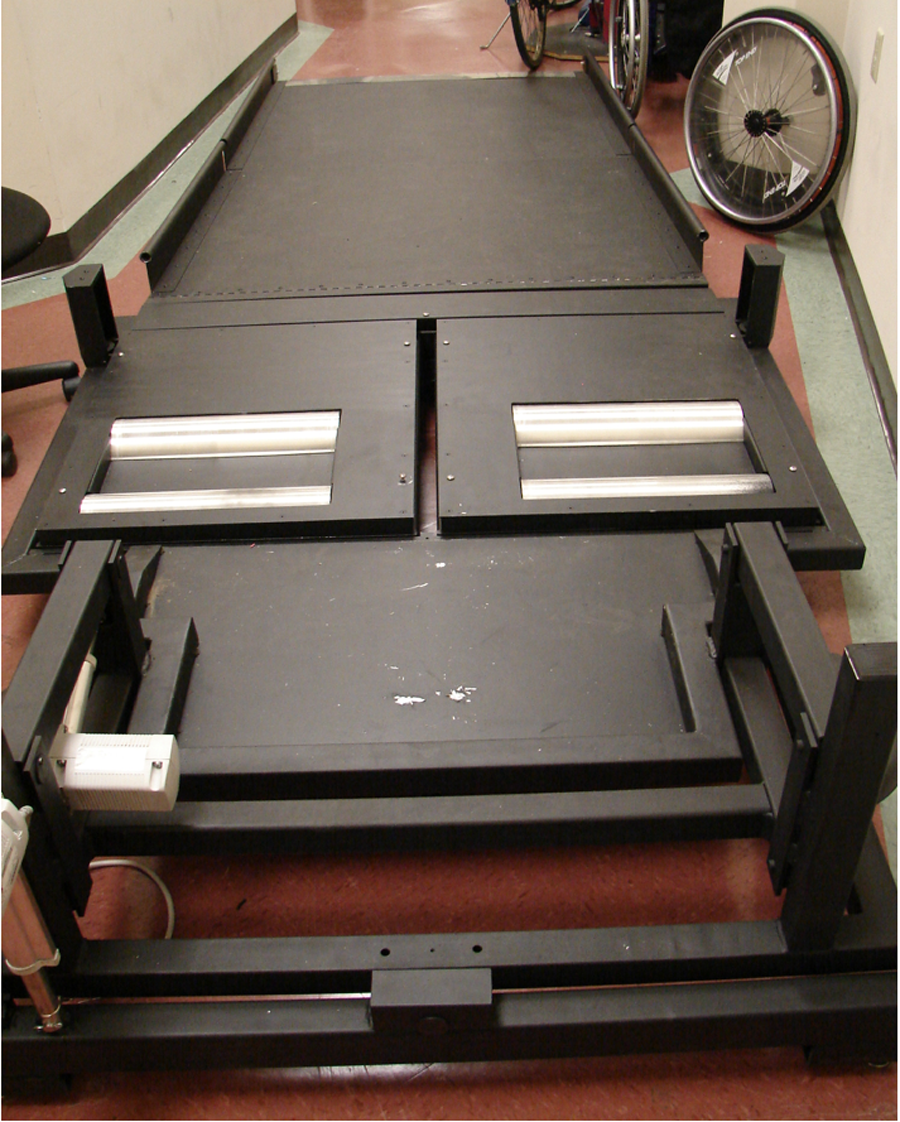
The purpose of this research was to develop and validate an endurance exercise assessment (peak oxygen consumption (VO2Peak)) protocol using an innovative wheelchair dynamometer, the Wheelmill System (WMS). The WMS exercise protocol was validated against the standard arm crank ergometer (ACE) exercise protocol. Ten participants were recruited from the community. VO2Peak was measured three times using the WMS twice, and an arm ergometer once. VO2peak was highly correlated between the two testing modes, indicating the WMS protocol to be reliable and valid compared to the gold-standard ACE protocol for MWUs with spinal cord injuries (SCI).
Introduction
Approximately 282,000 people in the United States are living with SCI (NSCISC, 2016) with a majority using a manual wheelchair for everyday mobility. Physical activity is very important for this population to maintain a healthy and independent lifestyle (Centers for Disease Control and Prevention (2007). Manual wheelchair users (MWU) are at increased risk of a sedentary lifestyle, possibly leading to an increase in susceptibility to cardiovascular disease (Haisma, 2006; Whiteneck, 1992).
Methods
We had an approved IRB protocol that was followed. Ten participants that had a spinal cord injury (level C5/6 or below) and used a manual wheelchair for everyday mobility were recruited. Prior to the exercise tests, all participants obtained approval and signed release from a medical physician.
All participants performed three incremental maximal exercise tests, two on a wheelchair dynamometer and one on an arm crank ergometer. Testing sessions were performed on three separate days; tests were conducted at least 48 hours apart. The order of the three exercise tests was randomized for each participant to minimize order and carry-over effects.
After participants were securely positioned in their everyday manual wheelchair on the testing device (dynamometer or ergometer), a 3-min standardized warm-up commenced, followed by a maximal exercise test using a continuous stepwise protocol with workload increases in 1-minute intervals until exhaustion. All maximal exercise tests were immediately followed by an active cool down period lasting at least three minutes. Standard indications for exercise test termination were used (ACSM 2014).
During the exercise tests, VO2 (L•min-1 and ml•kg-1•min-1), respiratory exchange ratio (RER), carbon dioxide production (VCO2; L•min-1), pulmonary ventilation (L•min-1), and energy expenditure (EE; Kcal•min-1 and AcKcal) were measured using a metabolic measurement system (TrueOne 2400, ParvoMedics, Sandy, UT, USA). Ratings of perceived exertion (RPE) was measured during the warm-up period, the last 30 seconds of each incremental stage, immediately following completion of the maximal test, and every minute of cool down. The Borg Scale (6-20; Flaherty, 2008) was used to measure RPE.
Results
Ten participants (Table 1) completed all exercise tests without any adverse events including no reports of severe pain, fatigue, or experiences of autonomic dysreflexia. Due to inability to maintain 60 rpm beyond 52 watts, one participant’s ACE test was terminated prior to volitional exhaustion (RER < 1.1; RPE < 17), therefore his ACEpeak data was excluded from statistical analysis.
There were no significant differences in VO2peak, peak HR, peak RER, peak RPE, peak AcKcal, peak rate of energy expenditure, or peak power output among WMS and ACE trials (Table 2). Between WMSpeak and ACEpeak tests, there were significant moderate-to-strong correlations for VO2 (P<0.05, r =0.79), HR (P<0.01, r =0.80), AcKal (P<0.01, r =0.81), rate of energy expenditure (P<0.01, r =0.90), and RPE (P<0.01, r =0.85; Table 3). Peak pulmonary ventilation had a strong correlation (P<0.01, r =0.87) between testing modes, however approached a significant difference (P=.088). Between WMS trials, significant moderate-to-strong correlations existed for VO2 (P<0.01, r =0.82), AcKal (P<0.01, r =0.91), rate of energy expenditure (P<0.01, r =0.94), and peak power output (P<0.01, r =0.98; Table 3).
| Participant | Testing Order | Age-predicted Max HR | Gender | Age | Injury Level | ASIA Level |
|---|---|---|---|---|---|---|
1 |
WM, AE, WM |
183 |
m |
37 |
C7 |
A |
2 |
AE, WM, WM |
193 |
M |
27 |
C7 |
B |
3 |
AE, WM, WM |
197 |
M |
23 |
C7 |
B |
4 |
AE, WM, WM |
197 |
M |
23 |
C6-7 |
B |
5 |
WM, AE, WM |
189 |
M |
31 |
C6-7 |
C |
6 |
WM, WM, AE |
192 |
M |
29 |
T-11 |
A |
7 |
WM, AE, WM |
156 |
M |
64 |
T8-9 |
B |
8 |
AE, WM, WM |
184 |
M |
36 |
C5-6 |
B |
9 |
WM, WM, AE |
192 |
M |
28 |
C6-7 |
B |
10 |
WM, WM, AE |
189 |
M |
31 |
T4-6 |
C |
| Variables | EE (kcal min-1) WMS1peak (n=10) | WMS2peak (n=10) | ACE peak (n=9) | WS130 W (n=10) | ACE 30 W )n=10) |
|---|---|---|---|---|---|
| VO2 (ml•kg-1•min-1) | 17.3 ± 3.3 |
18.1 ± 2.3 |
15.9 ± 2.0 |
9.0 ± 2.2 |
9.6 ± 1.4 |
| VO2 (L•min-1) | 1.3 ± 0.42 |
1.4 ± 0.31 |
1.2 ± 0.25 |
0.7 ± 0.12 |
0.73 ± 0.08 |
| RER | 1.1 ± 0.03 |
1.1 ± 0.02 |
1.2 ± 0.08 |
1.1 ± 0.13 |
0.91 ± 0.04 |
| HR | 140 ± 27.2 |
148.5 ± 27.0 |
131.2 ± 28.2 |
116.7 ± 28.76 |
94.3 ± 21.5* |
| Vemax (L• min-1) | 55.5 ± 13.8 |
56.0 ± 10.0 |
47.3 ± 11.0 |
- |
- |
| AcKcal | 38.3 ± 18.8 |
42.9 ± 14.9 |
36.1 ± 12.1 |
6.2 ± 4.5 |
10.54 ± 1.1 |
| EE (kcal min-1) | 8 ± 2.1 |
7.9 ± 1.6 |
7.5 ± 1.5 |
3.4 ± 0.6 |
3.5 ± 0.3 |
| RPE | 18.9 ± 0.94 |
19.4 ± 0.72 |
19.2 ± 0.69 |
9.8 ± 2.4 |
11.5 ± 1.8 |
| Workload (W) | 62 ± 20.93 |
62 ± 17.37 |
61.3 13.48 |
30 |
30 |
| WE (%) | - |
- |
- |
30.0 ± 7.4 |
31.9 ± 4.6 |
| ME (%) | - |
- |
- |
23.5 ± 7.5 |
20 ± 2.9 |
*Significant difference (P<0.05) |
|||||
| Variables | WMS1 vs. ACE (n=9) | WMS1 fs WMS2 (n=10) |
|---|---|---|
| VO2 (ml•kg-1•min-1) | 0.792† | .824* |
| RER | 0.252 | 0.316 |
| HR | 0.801* | 0.537 |
| Vemax (L• min-1) | .869* | .834* |
| AcKcal | .811* | 0..91* |
| EE (kcal min-1) | .899* | .954* |
| RPE | .845* | 0.125 |
| Workload | 0.775 | .983* |
| WEa | 0.584 | 0.001* |
| Mea | 0.133 | .680† |
† Correlation is significant at P < 0.05 |
||
Discussion
Participants exhibited moderate-to-strong correlations of cardiorespiratory responses between WMS and ACE with no significant differences between the two testing modes in regards to testing VO2peak. No significant difference was found between WMS trials. Overall, we feel that we demonstrated the validity of the WMS for a graded exercise challenge for the VO2Peak test. The time to exhaustion generally occurred within the 8-12 minute range. The WMS testing met the criteria for peak RER for VO2Peak testing, which is greater than or equal to 1.1. The participants almost all met the criteria for 80% of predicted peak heart rate (HR). The only statistically significant result that existed was HR however RPE approached significance between testing modes at submaximal workloads.
The test durations and RERs were similar between the three groups, indicating that the WMS was repeatable, and comparable to the arm ergometer. At submaximal workloads, mechanical efficiency was slightly higher in WMS compared to ACE however these results were not statistically significant. Differences in perceived exertion and efficiency at submaximal workloads and maximal pulmonary ventilation at peak workloads indicated potential advantages of the WMS protocol. Anecdotally, all but one of the participants preferred using the WMS for VO2Peak testing.
Conclusion
This study found VO2peak to be highly correlated between the two testing modes, indicating the WMS protocol to be reliable and valid compared to the gold-standard ACE protocol. The findings of this study has clinical implications by validating a newly developed exercise testing protocol that promotes task specificity and testing individualization.
Bibliography
National Spinal Cord Injury Statistical Center. Facts and Figures at a Glance. Birmingham, AL: University of Alabama at Birmingham. 2016.
Centers for Disease Control and Prevention (2007). Physical activity among adults with a disability-United States, 2005. Morbidity and Mortality Weekly Report; 56:1021-4
Haisma, J. A., Van der Woude, L. H., Stam, H. J., Bergen, M. P., Sluis, T. A., Bussman, J. B. (2006). Physical capacity in wheelchair-dependent persons with a spinal cord injury: a critical review of the literature. Spinal Cord, 44(11), 642-652.
Whiteneck, G. G., Charlifue, S. W., Frankel, H. L., Fraser, M. H., Gardner, B. P., Gerhart, K. A., Krishnan, K. R., Menter, R. R., Nuseibeh, I., Short, D. J., & Silver, J. R. (1992). Mortality, morbidity, and psychosocial outcomes of persons spinal cord injured more than 20 years ago. Paraplegia, 30(9), 617-630.
Vanhees L, Lefevre J, Philippaerts R, Martens M, Huygens W, Troosters T, Beunen G. How to assess physical activity? How to assess physical fitness? European Journal of Cardiovascular Prevention & Rehabilitation. 2005;12(2):102-114.
Knechtle B, Kopfli W. Treadmill exercise testing with increasing inclination as exercise protocol for wheelchair athletes. Spinal Cord. 2001;39(12):633-636.
Ilias, Nasreen A., Hong Xian, Cindi Inman, and Wade H. Martin. "Arm Exercise Testing Predicts Clinical Outcome." American Heart Journal 157.1 (2009): 69-76.
Klaesner, J., Morgan, K. A., & Gray, D. B. (2013). The development of an instrumented wheelchair propulsion testing and training device. Assistive Technology.
American College of Sports Medicine, Pescatello LS. ACSM’s Guidelines for Exercise Testing and Prescription (9th ed.) Philadelphia: Wolters Kluwer/Lippincott Williams & Wilkins. 2014.
Flaherty E. How to try this: Using pain rating scales with older adults. American Journal of Nursing. 2008;108(6):40-47.