Wording Matters: Preliminary Results In Identifying Students With A Disability In Postsecondary Education
Jacqueline M. Love, BS
Roger O. Smith, PhD, OT, FAOTA, RESNA Fellow
University of Wisconsin Milwaukee, R2D2 Center
ABSTRACT
The prevalence of years and it is likely that even more students with disabilities exist that have not disclosed their disability to the university. There are many reasons why students choose not to disclose, but when they don’t, the university cannot accommodate their academic needs. This can result in poor academic achievement and even failure to obtain a degree. As a college degree becomes more vital to job attainment, identifying students with disabilities and getting them the proper support becomes more crucial. This study aimed to take a closer look at the prevalence of disability on a college campus, evaluate how the diction we use to discuss disability impacts the level of disability disclosure, and report on the differential outcomes of the wording. students with disabilities (SWD) in postsecondary education has increased exponentially over the last 30
introduction
The diversity of the student population, including minorities, students over the age of 25 and students with disabilities in postsecondary education, has grown substantially over the last two decades (Roberts et al, 2011). In 1978, studies showed that full-time students with disabilities at the postsecondary education level was only 2.6%. In 2011, this number was up to 11.3% and other studies suggest that as much as 50% of students with disabilities do not disclose their disabilities to their universities or professors (Smith, Hirschman, Rust, 2010). This which would indicate that the percentage of the student population that may needs different from that of mainstream students could be as high as 18-20% (Roberts, 2011).
Many students choose not to disclose their disabilities which impacts their ability to get access to the resources that they need to succeed in postsecondary education. There are many reasons that a student may choose not to disclose their disability to the university (Goode, 2006). Some simply don’t know how to do so or don’t fully understand how doing so may benefit them in their educational pursuit. Others are acutely aware that officially disclosing their disability often makes them extra visible to their classmates, friends, and teachers. This calls attention to their disability and can make the student feel like an outsider in their classroom and opens the door for discrimination, both unintentional and intentional. Many students also struggle with their own identity as a SWD and do not see agreement in the way the university classifies SWD and how they see themselves. Lastly, some students who want to disclose never officially do because of the amount of paperwork required to do so. Declaring a disability with the university in order to gain access to services is an extensive process that requires detailed planning and organization, executive functions that many 18 years old struggle, regardless of disability status.
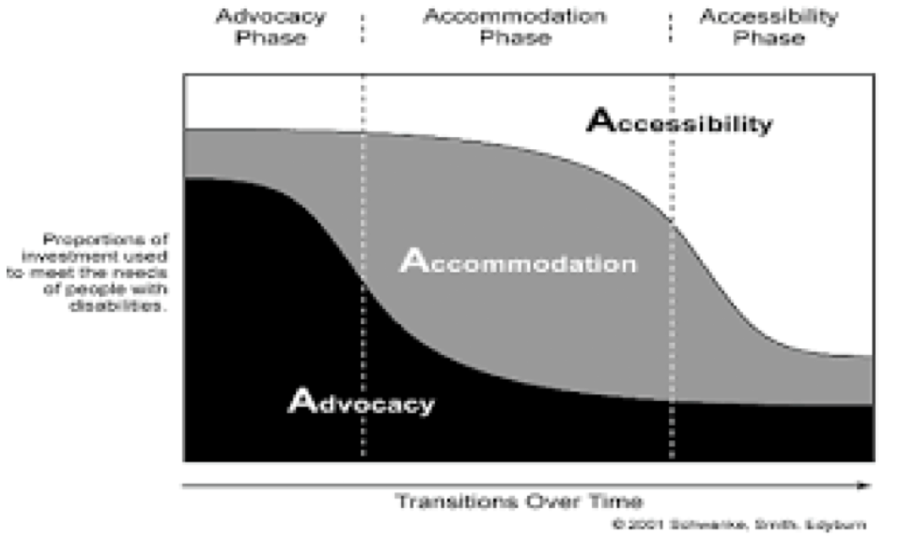
Postsecondary education is largely functioning in the Accommodation phase of this model. Students with disabilities must individually contact the university and provide documentation to prove their disability in order to qualify for academic accommodations (Eckes & Ochoa, 2005). As previously stated, many students do not disclose their disabilities to the university, resulting in a lack of accommodation and academic supports in higher education.
Hypotheses
- The prevalence of disability in postsecondary education is much higher than currently anticipated.
- Using words like impairment or diagnosis instead of disability will allow more students to affiliate and disclose their disability.
Methods
Survey Design
This study was administered through use of an anonymous survey. The survey contains 16 questions which establish basic demographics such as time in postsecondary education and field of study. The survey then asks the student whether or not they have a disability in 4 different ways. When asking SWDs to disclose their disabilities, universities commonly ask “Do you have a disability; yes or no?”. For this survey, we start with that question and then included questions that focused more on medical diagnoses and perceived functional impairments to see if there was a difference in how students answered questions that were worded differently, but still trying to get at the same basic information. The survey ended with questions which assess the students’ knowledge and usage of the student accessibility center on campus. One question also checks to make sure that the student has not taken the survey as part of another course in order to avoid duplicate responses.
Recruitment
Participants recruited were all students at the University of Wisconsin-Milwaukee (UWM) during the Fall 2016 semester. Classes were selected for participation by using the course calendar for the fall 2016 semester at UWM. Courses that are taken predominantly by underclassmen were selected, in order to target that demographic. According to Thurlow, Sinclair, and Johnston, the dropout rate for students with disabilities is approximately twice that of general education students and these dropouts are more likely to happen in the first couple of years of schooling. Targeting the student population before substantial dropouts were likely was relevant for the study. Fifty course professors were contacted via email with a description of the study and 11 agreed to facilitate participation with their students. Research participation was optional and anonymous. It was made clear to all students that a decision not to participate would in no way affect their grades or standing at the university.
| Department | # of Students | Present | Declined | instruction method |
|---|---|---|---|---|
| Biosci | 83 | 40 | 2 | in person |
| English | 38 | 38 | 0 | in person |
| Econ | 60 | 59 | 0 | in person |
| Nursing | 156 | 152 | 0 | in person |
| Public Health | 44 | 43 | 3 | in person |
| English | 14 | 14 | 0 | in person |
| Kinesiology | 55 | 53 | 0 | in person |
| Business | 200 | 150 | 1 | In person |
| English | 24 | 24 | 0 | online |
| English | 20 | 17 | 0 | online |
| psych | 280 | 180 | 100 | online |
Participant Demographics
According to preliminary data, 614 students from 10 different courses have participated in this study. 71% of participants held either a freshman or sophomore status and 92% held a junior status or below. The field of study that the students identified as their own varied substantially and included all colleges at UWM except the College of Freshwater Sciences.
Results
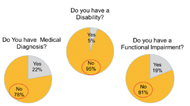
The graphs above show discrepancy of disability identification based on question phrasing. SWD appear to have largely underreported their disability when it was related to medical diagnoses or functional impairments usually associated with a disability.
When students were asked if they had disclosed their disability to the university, almost 77% said no. Reasons why they had not disclosed included: “didn’t know I could, did not know how, did not think it would help, did not want the university to know about my disability, and do not need/want accommodations.”
When the students were asked if they were aware of the services provided by the office of disability student services on campus, only 47% responded yes, and of those, only 6% had actually used those services before.
Discussion & IMPLICATIONS
Ongoing data analysis prevent the discussion of any notable trends or findings, however, preliminary data suggests there may be many more people with disabilities on college campuses than universities are currently estimating. Data may also indicate that different outreach methodologies might be considered when trying to advertise the services of the disability student programs on college campuses since more that 50% of the polled students did not know what services they provided. Further analysis of this data should help illuminate the reasons behind the discrepancies and help us justify the need for universal design (UD) approaches in post-secondary education in order to assist in successful educational engagement by all students.
Rehabilitation engineering and assistive technology professionals are often the advocates and purveyors of universal design concepts, approaches and direct implementors of UD interventions need evidence that supports the rationale for using UD. These preliminary data begin to reveal how dramatic the need might be for UD approaches. The difference between the numbers of students that identify as having a disability versus the number of students that might benefit from an intervention,
References
Bowe, F. (2000). Universal design in education: Teaching nontraditional students. Greenwood Publishing Group.
Eckes, S. E., & Ochoa, T. A. (2005). Students with disabilities: Transitioning from high school to higher education. American Secondary Education, 6-20.
Goode, J. (2007). ‘Managing’disability: Early experiences of university students with disabilities. Disability & Society, 22(1), 35-48.
Roberts, K. D., Park, H. J., Brown, S., & Cook, B. (2011). Universal Design for Instruction in Postsecondary Education: A Systematic Review of Empirically Based Articles. Journal of Postsecondary Education and Disability, 24(1), 5-15.
Schelly, C. L., Davies, P. L., & Spooner, C. L. (2011). Student Perceptions of Faculty Implementation of Universal Design for Learning. Journal of Postsecondary Education and Disability, 24(1), 17-30.
Schwanke, T. D., Smith, R. O., & Edyburn, D. L. (2001). A3 model diagram developed as accessibility and universal design instructional tool. In RESNA 2001 annual conference proceedings (Vol. 21, pp. 205-207).
Zimmer, M. A. (2012). Universal Design in Higher Education: From Principles to Practice–Edited by Sheryl E. Burgstahler and Rebecca C. Cory. Teaching Theology & Religion, 15(1), 89-91.
ACKNOWLEDGEMENTS
The National Research Center for Distance Education and Technological Advancements (DETA) is supported in part by the U.S. Department of Education's Office of Postsecondary Education, PR/Award #P116Q140006. The opinions contained in this proposal do not necessarily represent the policy of the Department of Education, and you should not assume endorsement by the Federal Government.