Jaimie Borisoff1,2, Jacquie Ripat3, and Franco Chan2
1British Columbia Institute of Technology, Vancouver, BC, Canada; 2International Collaboration On Repair Discoveries, Vancouver, BC, Canada; 3University of Manitoba, Winnipeg, MB, CanadaIntroduction
Wheelchairs are intended to promote the mobility and community participation of people with disabilities. But many people who use wheelchairs report less community participation than people without disabilities, including leaving their home (Harris, 2007) and involvement in social relationships (Carpenter et al., 2007). Fostering participation is important because it’s considered the most meaningful goal of rehabilitation (Miller, Garden, & Mortenson, 2011), and a significant predictor of subjective quality of life (Noreau et al., 2005). Unfortunately, many feel that their wheelchair poses a greater barrier to participation than their actual mobility impairment, especially if the equipment is poorly matched to their specific needs and environments of use (Carpenter et al., 2007; Whiteneck et al., 2004).
Several general barriers to wheelchair use and community participation are known, notably the built and natural environments. One aspect of the natural environment that is often a barrier to participation is climate, in particular winter conditions (Hammel et al., 2008; Juvani, Isola, & Kyngäs, 2005; Lindsay & Yantzi, 2014; Ripat & Colatruglio, 2016). Winter, snow, and ice are well established as substantial obstacles to individuals who use mobility devices, including wheelchairs, particularly around community integration and involvement in desired social roles (Lindsay & Yantzi, 2014; Ripat, Borisoff, Grant, & Chan, 2017; Skinner, Yantzi, & Rosenberg, 2009).
However, there is little known about how the patterns of community participation differ across the seasons for people who use wheelchairs as their primary mode of mobility, or how specific winter conditions impact participation patterns. The use of data loggers, on wheelchairs or otherwise, is one method of objectively documenting the patterns of community participation. Most data logging studies have been of limited duration, reporting only cross sectional data collection periods of 1-3 weeks. One longitudinal study reported on a single case of one individual post stroke (Neven et al., 2013) with data collected for five 1-week periods over 12 months. A second study compared community participation patterns in summer and winter by tracking the travel patterns of 40 healthy older adults using global positioning system (GPS) monitoring in California, USA (Yen et al., 2015), however little difference was seen and there was no indication that winter conditions included snow, ice or temperatures at or below 0° Celsius (Yen et al., 2015).
We recently reported on a year-long case study of three Canadian wheelchair users using GPS tracking and prompted recall interviews (Ripat et al., 2017). One subject maintained the mean distance traveled throughout the year, while the other 2 saw decreases in temperatures below 0⁰. Another subject maintained the number of trips taken throughout the year, while the other 2 saw decreases when temperatures fell below 0⁰. All subjects used a variety of strategies in response to winter weather challenges. And ready access to accessible vehicular transportation regardless of weather condition was a key factor in promoting community participation across the year.
The goal of our larger research study was to describe how wheelchair users participate and move at home and in the community during an entire year, including when faced with widely varying weather conditions, using both GPS tracking and accelerometers to measure bouts of wheeling mobility. Quantitative and qualitative methods were used to attempt to identify which factors, if any, were associated with differing wheelchair use during different weather conditions. The purpose of this paper is to provide a detailed overview of the methods used in this study, and to provide aggregate descriptive data from the 11 participants.
Methods
The study was approved by the University of Manitoba Health Research Ethics Board and all participants signed informed consent. Participants were recruited through advertisements sent to organizations associated with people who use wheelchairs in Winnipeg, Manitoba. Inclusion criteria were individuals who reported using their wheelchair for outdoor use throughout the year; were willing to engage in monthly interviews across one year; and were willing to have GPS and accelerometers attached to their wheelchair. Along with other demographic data, we also documented their transportation use, whether via a privately owned vehicle or public transportation (e.g., para-transit, a publically-run system of accessible vehicles and drivers that one books 1-2 days prior to use).
For each participant, a minimum of 12 sets of data were collected, in 1 week blocks over the span of 1-year. There were three main methods of data collection. One, a GPS data logging system (Super Trackstick, Telespatial Systems Inc.) was installed on the participant’s wheelchair. This measured outdoor travel, including distance, number of trips, destinations, frequency of use, and time spent out of the home. A custom MATLAB (Mathworks Inc., Natick, MA) program was developed to calculate trips based on the ‘moving’ or ‘stopped’ labels as recorded by the GPS logger. A stopped label was assigned if no signal was acquired or if the no movement was detected for longer than 2 minutes. Subsequent stops within 100m of one another were assigned as the same stop. The Great Circle Distance method (Weisstein) was used to calculate the distance between consecutive stopped points.
Two, daily wheelchair movement was recorded using a 3-axis accelerometer (X16-1D, Gulf Cost Data Concepts (GCDC)) mounted on the spokes of one wheel. The battery life typically lasted for at least 7 days using customized device configuration. The signal processing procedure, using MATLAB, used an algorithm originally developed and validated by Sonenblum et al. (2012). Using the known wheel diameter, the rotational speed was converted to wheelchair velocity in meters per second. Bouts of wheeled mobility were then calculated using the distance, velocity, and time of each wheelchair activity. A bout of mobility was defined as any movement that (i) lasted at least 5 seconds, (ii) had a speed greater than or equal to 0.12 m/s, and (iii) ended when less than 0.76 m were wheeled within 15 seconds. Once the bouts of mobility were calculated, the timestamps, duration, distance, and speed for each bout were available for further analysis.
Seven days of data were collected during each “1 week” block each month. The number of days collected for GPS and accelerometry varied slightly depending on battery life of each device. The first (i.e. installation) and last days were not included in the analysis due to the interactions between participants and researchers which disrupted normal routines.
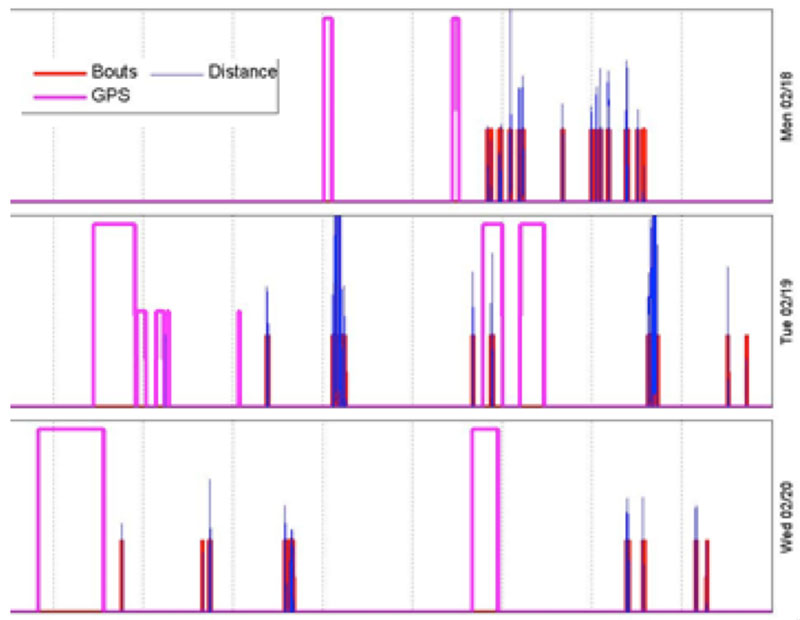
Each participant’s bouts and GPS data were compiled and loaded into MATLAB for further processing. The number, duration, distance, and speed of movement were calculated, separately grouped with means and medians either daily, minutely, or per bout. Representative data from one participant is shown in Fig. 1.
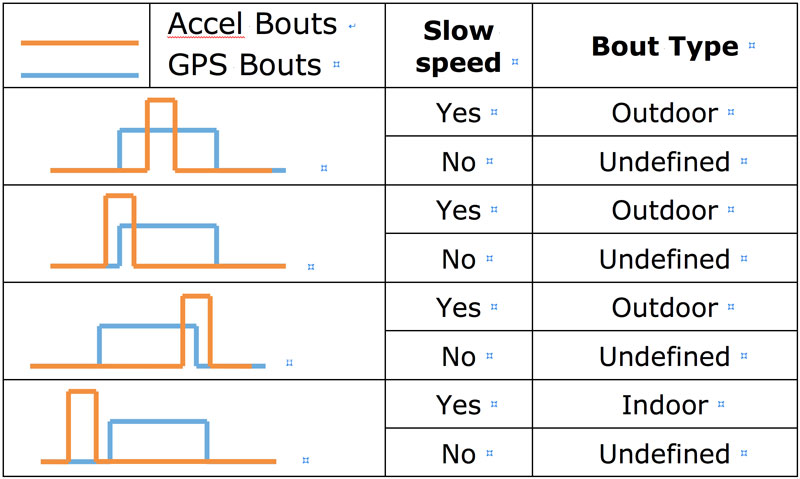
The GPS data was used to determine if movements occurred outdoor or indoor, as follows. Speed was categorized as either slow, i.e. between 0.11 m/s to 5.56 m/s (20 km/h), or fast, i.e. greater than 5.56 m/s. For instance, if an accelerometer bout occurred within the time duration of a GPS bout and if the speed was slow, a bout was considered as outdoor. Other possibilities are shown in Fig. 2., and enabled the calculation of which bouts of mobility occurred indoor or outdoor. The outdoor, indoor, and undefined bouts were normalized to number of collection days per block, and the outdoor to indoor ratios were calculated.
To compare seasonal winter conditions, various data were grouped or correlated into ‘at or above 0°C’ and ‘below 0°C’. Daily weather data from 2012 to 2014 in Winnipeg, Manitoba, was obtained from the Government of Canada weather database (Historic climate data). In Winnipeg, temperatures average below zero degrees Celsius (32° F) from November to March, with a yearly average snowfall of 111 cm (National climate data archive). A cubic spline method was used to interpolate any missing temperature data, and a seven-day rolling average was applied to smooth daily variations. Data were also grouped into four nominal seasons for additional comparisons: winter (Dec-February), spring (March-May), summer (June-August), and fall (September-November).
results
Eleven full-time wheelchair users were recruited for the study. Four used power wheelchairs, and seven used manual wheelchairs. Two of the participants were dependent on a caregiver for help with their mobility needs.
All 11 participants were studied over a full 12 months. 1,105 total number of days of data were collected. Data collection included days with severe winter weather conditions, i.e. 232 days had a temperature below 0°C, and 235 days had snow on the ground.
Over the entire year, 2,855 total trips and 35,355 total bouts of mobility were recorded. Considering a typical full day of mobility, participants wheeled a median of 57 bouts per day, for a distance of 1.1 km and total duration of 44 min. A preliminary analysis of GPS tracking was conducted by grouping the mean number of GPS trips per day, taken each season, into four nominal seasons: winter, spring, summer, and fall. The group means across all participants were then calculated (Table 1). Further comparative analysis of this data set is forthcoming.
Season |
Dec-Feb |
Mar-May |
Jun-Aug |
Sep-Nov |
|---|---|---|---|---|
Mean (SD) |
2.33 (1.55) |
2.31 (1.52) |
3.14 (1.87) |
2.21 (1.45) |
discussion
With this investigation, we have attempted to develop a holistic picture of a person’s home and community participation and mobility experience when using a wheelchair over the span of an entire year. To our knowledge, this is the first longitudinal data logging study of wheelchair users across a full year. The collected days of data include substantial winter weather conditions that are known to impact wheeled mobility and participation (Hammel et al., 2008; Juvani et al., 2005; Lindsay & Yantzi, 2014; Ripat & Colatruglio, 2016; Ripat et al., 2017; Skinner et al., 2009). Conducting long-term studies across varying conditions, e.g., fluctuations in temperature and precipitation that may create differences in community participation, are important to a full understanding of the barriers experienced by individuals who use wheeled mobility devices.
We have also attempted to address limitations in other studies where data collection has been through one means only (e.g., GPS), studies which have been short in duration, or when the effects of weather have not been considered, to gain a comprehensive understanding of influences on mobility and community participation.
In conclusion, we presented the methodology used to successfully record data from 11 participants over an entire year-long period, including periods with a significant number of days with inclement winter weather. Further analyses of this unique data set are forthcoming, including data collected using both quantitative and qualitative methods, to describe the participation and mobility patterns of wheelchair users across the seasons. In the future analysis, we will also attempt to ascertain which factors, if any, were strongly associated with greater or lesser community participation and wheelchair mobility indoor.
REFERENCES
Carpenter, C., Forwell, S. J., Jongbloed, L. E., & Backman, C. L. (2007). Community participation after spinal cord injury. Archives of Physical Medicine and Rehabilitation, 88(4), 427-433.
Climate. Historic climate data. Retrieved from http://climate.weather.gc.ca/
Hammel, J., Magasi, S., Heinemann, A., Whiteneck, G., Bogner, J., & Rodriguez, E. (2008). What does participation mean? an insider perspective from people with disabilities. Disability and Rehabilitation, 30(19), 1445-1460.
Harris, F., Sprigle, S., Sonenblum, S. E., & Maurer, C. L. (2010). The participation and activity measurement system: An example application among people who use wheeled mobility devices. Disability and Rehabilitation.Assistive Technology, 5(1), 48-57.
Harris, F. (2007). Conceptual issues in the measurement of participation among wheeled mobility device users. Disability and Rehabilitation: Assistive Technology, 2(3), 137-148.
Juvani, S., Isola, A., & Kyngäs, H. (2005). The northern physical environment and the well-being of the elderly aged over 65 years. International Journal of Circumpolar Health, 64(3), 246-256.
Lindsay, S., & Yantzi, N. (2014). Weather, disability, vulnerability, and resilience: Exploring how youth with physical disabilities experience winter. Disability and Rehabilitation, 36(26), 2195-2204.
Miller, W. C., Garden, J., & Mortenson, W. B. (2011). Measurement properties of the wheelchair outcome measure in individuals with spinal cord injury. Spinal Cord, 49(9), 995-1000.
National climate data and information archive. http://climate.weatheroffice.gc.ca/climate_normals/index_e.html
Neven, A., Janssens, D., Alders, G., Wets, G., Van Wijmeersch, B., & Feys, P. (2013). Documenting outdoor activity and travel behaviour in persons with neurological conditions using travel diaries and GPS tracking technology in multiple sclerosis. Disability and Rehabilitation, 35(20), 1718-1725.
Noreau, L., Fougeyrollas, P., Post, M., & Asano, M. (2005). Participation after spinal cord injury: The evolution of conceptualization and measurement. Journal of Neurologic Physical Therapy : JNPT, 29(3), 147-156.
Ripat, J., & Colatruglio, A. (2016). Exploring winter community participation among wheelchair users: An online focus group. Occupational Therapy in Health Care, 30(1), 95-106.
Ripat, J., Borisoff, J. F., Grant, L. E., & Chan, F. H. N. (2017). Patterns of community participation across the seasons: A year-long case study of three canadian wheelchair users. Disability and Rehabilitation, 1-10.
Skinner, M. W., Yantzi, N. M., & Rosenberg, M. W. (2009). Neither rain nor hail nor sleet nor snow: Provider perspectives on the challenges of weather for home and community care. Social Science & Medicine, 68(4), 682-688.
Sonenblum, S. E., Sprigle, S., Caspall, J., & Lopez, R. (2012). Validation of an accelerometer-based method to measure the use of manual wheelchairs. Medical Engineering & Physics, 34(6), 781-786.
Weisstein, E. Great circle. Retrieved from http://mathworld.wolfram.com/GreatCircle.html
Whiteneck, G., Meade, M. A., Dijkers, M., Tate, D. G., Bushnik, T., & Forchheimer, M. B. (2004). Environmental factors and their role in participation and life satisfaction after SCI. Archives of Physical Medicine and Rehabilitation, 85(11), 1793-1803.
Yen, I. H., Leung, C. W., Lan, M., Sarrafzadeh, M., Kayekjian, K. C., & Duru, O. K. (2015). A pilot study using global positioning systems (GPS) devices and surveys to ascertain older adults’ travel patterns. Journal of Applied Gerontology, 34(3), NP190-NP201.
Acknowledgements
Lea Grant was the research assistant for this study. This study was funded by the University of Manitoba, Faculty of Medicine [ReHabilitation Grant Program]. JB is the Canada Research Chair in Rehabilitation Engineering Design.