Design And Development Of At-Node: A Searchable Database Of Text Entry Rates For Computer Users With Disabilities
Heidi Koester1 and Sajay Arthanat2
1Koester Performance Research, 2University of New Hampshire
INTRODUCTION
Entering text is one of the main tasks people do with their computers, AAC systems, tablets, or other ICT devices. For computer users with physical impairments, finding an easy and productive method of text entry is fundamental to a successful access intervention. We have been working to organize the available evidence on text entry performance in order to build foundational knowledge and inform decision-making.
As part of our work in this area, we have developed a web application called AT-node for Access. Its purpose is to maintain the world’s data on computer access outcomes in support of evidence-based decision-making for practitioners, researchers, and people with disabilities. It allows users to retrieve text entry performance data using a free-text search or by specifying an interface, diagnosis, or body site. This paper describes the design and development process used to build AT-node. This provides insight into the workings of the current system, and a reference to a process that could be used to create similar tools in other domains of assistive technology.
BACKGROUND
We recently completed a systematic review on computer text entry by people with physical disabilities. We found 39 studies that met all inclusion criteria, dating back to 1986, and have used the data to report on the text entry rates associated with different interfaces, diagnoses, and body sites [1,2]. We started with text entry rate (TER) as that is a key metric for the speed and productivity of an access system.
Given the extensive time and effort involved in gathering these data, and the number of useful questions that could potentially be addressed with the data, we decided to make the data available to others in a readily useable form. The goal is to provide a tool that will facilitate evidence search and dissemination and can be updated over time as new research emerges.
METHODS
System requirements
The key requirements identified for AT-node include the following:
- Run on a web browser, for readily available access to the system without an installation step
- Walk-up-and-use with ease
- Maintain complete information on manuscripts identified in our systematic review
- Store all text entry rate measurements and associated characteristics that occur within those manuscripts
- Support appropriate and efficient searches for text entry rate data
- Produce useful reports using the retrieved data, including graphical summaries, data tables, and manuscript citations and abstracts
- Flexible database design to allow for evolution over time. This may include additional metrics (beyond text entry rate) from studies that are already in the database, searches based on hypothesis or study goal, addition of new studies as they are published, addition of data collected by practitioners (not necessarily in published studies), and possible support for other types of assistive technology.
User interface design
A variety of ideas for the user interface were explored using paper-and-pencil drawings. We benchmarked other tools related to search-and-data for their presentation of search options as well as the retrieved results, such as PubMed, Wolfram Alpha, google Sheets, and others. We then used the Sketch drawing program to develop the visual design further, revising the ideas until we had high-fidelity mockups of each screen in the workflow.
Evaluation of concept and design
We evaluated the AT-node concept and design in two main activities. First, three ATPs with experience in computer access used a click-through mockup of AT-node. We built the mockup using a tool called Marvel, which allowed us to upload screen images created in Sketch, then link the images together with clickable hotspots. This allows the user to interact with the system for a specific task or path through the application, and to view each page within the system. (See it at marvelapp.com/1dj0ed3). In a one-on-one session with the first author, each user conducted several pre-defined searches with the mockup, then answered a variety of Likert-type and open-ended questions. Users were also encouraged to make suggestions at any time while interacting with the mockup. These three practitioners expressed positive interest in the concept and provided many excellent suggestions, most of which we incorporated into the design.
We also surveyed 10 workshop attendees at the RESNA 2017 Conference, who saw a demonstration of the functioning AT-node system. They anonymously rated their agreement with 5 different statements on a scale of 1-5 and also listed additional desirable features or other thoughts about the system. There was high agreement to all but one statement; e.g., Helpful to the AT field averaged 4.3 out of 5, and Easy to use averaged 4.4 out of 5. The statement that “I would want to add my own data” was the one that received more mixed responses: three attendees stated that was not applicable to them, and the remaining responses ranged from 1 to 5.
Database schema and implementation
While the user interface represents the “front end” of the system, the database itself is the “back end.” Our first step in designing the database was to choose a relational database, as opposed to a non-relational approach. The relational database suites the problem well because it allows us to explicitly model the existing relationships in the manuscript data (e.g., a study has 1 or more subject groups; each subject group has 1 or more subjects; each subject has 1 or more text entry rate measurements, etc.). It also supports a well-established method of retrieving data from the database, using the SQL language.
We followed Hernandez’ process [3] to design the database schema including establishing the table structures, defining table keys, specifying the table fields, and defining the table relationships. It was important to do this properly, as it can be difficult to make major revisions to the database schema once it is in place. The primary goals were to support unambiguous SQL queries for retrieving desired information, and to flexibly model the current text entry rate data while providing for addition of other types of data easily over time.
A diagram illustrating the database schema can be found at kpronline.com/ter-review.php. After creating the database according to the schema, we then had to populate it with actual data, by reorganizing and moving data from the collection of spreadsheets that we had been using into the database tables and fields. The current database contains data from 39 published articles, including 120 group results (e.g., the average text entry rate for a subject group) and 318 case results (e.g., text entry rate for an individual subject in a particular condition).
The schema could be readily adapted for use with any domain of assistive technology. While some of the data tables or fields are specific to the access domain, such as an interface table to hold data about particular access interfaces and their setup, most of the tables deal primarily with generic constructs such as subject groups, subjects, dependent variables, and independent variables.
Application development

The primary tasks of the application are to:
- Present the appropriate HTML page in response to the browser URL.
- Allow the user to specify search criteria by interacting with an HTML page.
- Convert the user’s input to a well-formed SQL query statement that the database will understand.
- Receive and analyze the data returned from the database.
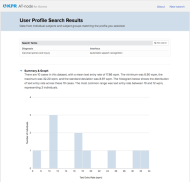
- Create the statistics and graphs for the data and present them to the user in an HTML page.

USING AT-NODE
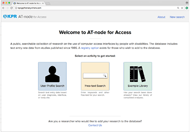
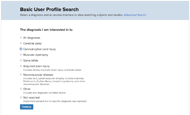
AT-node is deployed on the PythonAnywhere platform and is freely available for use at kpronline.com/atnode. Figure 1 shows the home page, with the three main activities that are available: a User Profile Search to quickly search based on interface, diagnosis, and body site (see Fig 2); a Free-text Search to enter search terms directly; and an Example Library with examples of how to use AT-node and resources for learning more.
Figure 2. Screenshot in the User Profile Search, to select a diagnosis if desired. Combinations of more than one diagnosis can be selected using the Advanced Search.

FUTURE WORK
AT-node for Access is an early version of a tool to support the use and dissemination of evidence in the area of computer access for people with disabilities. We welcome ideas regarding its further development in this domain. We are also interested in applying these design and development methods to data in other AT domains and are happy to share this information in more detail. Please visit kpronline.com/ter-review.php for additional resources.REFERENCES
- Koester HH, Arthanat S. (2017). Effect of diagnosis, body site, and experience on text entry rate of individuals with physical disabilities: A systematic review. Disability & Rehabilitation: Assistive Technology, ePub ahead of print. http://www.tandfonline.com/eprint/MKjjiM9rX8EiRbBR5sZe/full
- Koester HH, Arthanat S. (2017). Text Entry Rate of Access Interfaces Used by People with Physical Disabilities: A Systematic Review. Assistive Technology, ePub ahead of print. http://www.tandfonline.com/eprint/4A2Gu8hJRmY8cUVsbdxk/full
- Hernandez MJ. (2013). Database Design for Mere Mortals, 3rd ed. New York: Addison Wesley.
- Viescas J, Hernandez MJ. (2014). SQL Queries for Mere Mortals, 2nd ed. New York: Addison-Wesley.
- Barry P. (2017). Head First Python. Boston: O’Reilly.