Tara O’Neill1, Krista M. Wilkinson1,2, Janice Light1
1The Pennsylvania State University, 2Shriver Center of the University of Massachusetts Medical School
INTRODUCTION
Augmentative and alternative communication (AAC) technologies are an effective and evidence-based intervention to improve communication and enhance meaningful participation in society for individuals who experience significant communication challenges [1]. In order to derive the benefits offered by AAC, the design of AAC technologies must be grounded in a theoretical understanding of basic visual cognitive processes [2].
Visual cognitive processing of AAC interfaces is a critical area for examination because communicating via AAC requires the use of an external display that is represented and accessed visually. Users must be able to visually attend to and extract information from the display [3]. A visual scene display (VSD) is one common type of AAC interface. VSDs depict people engaged in meaningful activities within an integrated scene such as a photograph, with language concepts embedded as hotspots. Wilkinson and Light [4] utilized eye-tracking technology to examine visual attention within natural scenes (i.e. VSDs) and found that humans exerted a powerful influence on visual attention from individuals with neurodevelopmental disorders.
However, AAC VSDs are often more complex than a single photograph. AAC technologies organize vocabulary across multiple displays in order provide with user with access to a larger lexicon. Navigation between displays is typically achieved through a menu that contains small thumbnails of possible displays. Therefore, it is critical to examine visual attention to more complex interfaces that include both a main display and a navigation menu. The spatial arrangement of the navigation menu is one feature that may influence visual attention patterns because location in the visual field has a powerful influence on visual cognitive processing [2].
The purpose of this investigation was to examine how the spatial arrangement of the navigation menu, relative to the VSD, influenced visual attention patterns by individuals with neurodevelopmental disabilities. This type of systematic empirical investigation will contribute to an evidence base from which clinicians, AAC manufacturers, and app developers can tailor the design of AAC technologies to the visual cognitive processing skills of users.
METHODS
Participants
The study included four groups of participants: three groups of individuals with significant language disabilities associated with autism spectrum disorder (ASD, n=13), Down syndrome (DS, n=13), or other intellectual disabilities (IDD, n=9); and one group of preschoolers with typical development (TD, n=20). Participants with disabilities were included in the study if their Peabody Picture Vocabulary Test (PPVT-4) [5] score was more than 2 standard deviations below the mean (i.e., <70). Table 1 presents demographic information for the participants in each group including PPVT-4 age equivalents, PPVT-4 standard scores, and chronological ages. A group-wise matching strategy was not employed in this study for several reasons. First, there are inherent limitations in group-wise matching [e.g., 6]. For example, matching based on receptive language skills would eliminate those participants with the most significant language challenges who are most likely to benefit from AAC. Second, due to challenges of obtaining valid data with individuals with disabilities, data loss can be significant, and the exclusion of participants based on language age could lead to small sample sizes and limit conclusions [7].
| TD | DS | ASD | IDD | |
| Measure | mean (SD) | mean (SD) | mean (SD) | mean (SD) |
|---|---|---|---|---|
| PPVT standard score | 114 (14) | 46 (14) | 29.5 (18) | 40 (20) |
| PPVT age equivalent (years) | 5.1 (1.5) | 5.8 (2.0) | 3.5 (1.9) | 4.8 (1.8) |
| Chronological age (years) | 4.1 (0.7) | 16.5 (6.1) | 15.7 (3.4) | 15.5 (4.4) |
Stimuli and experimental procedures
This investigation examined visual attention to stimuli that closely conform to the recommendations for the composition of VSDs. VSDs were constructed, each of which contained two children engaged in one of four meaningful shared activities; reading a book, eating snack, petting a dog, or swinging in a tire swing. In each stimulus, one of the photographs was featured in the center of the display, measuring about 17 by 17 cm; this was considered the main VSD for that stimulus. In addition to the main VSD, each stimulus also contained a smaller strip that simulated a navigation menu or bar (henceforth, “navigation bar”). This navigation bar contained all thumbnail sized images of each of the four possible photographs (reading, snack, dog, swing). Figure 1 presents one example stimulus. The navigation bar appeared in one of 4 different locations: in some cases, it appeared at the top horizontally, in others on the bottom horizontally, on the left vertically, or on the right vertically. Each bar location was presented 4 times within the experimental task (i.e., 4 stimuli included the bar on the top, 4 included the bar on the left, etc.).

Data preparation and dependent measures
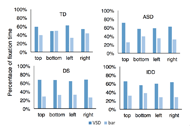
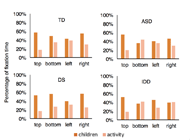
A drawing function on TOBii studio software was used to create areas of interest (AOIs) on each stimulus. Each stimulus contained AOIs for the main VSD and the bar. Within each main VSD, there were AOIs for the children and the shared activity. The software matched the point of x-y gaze coordinates collected by the T60 monitor to the coordinates defined within each area of interest. This allowed for evaluation of visual attention to each area.
The dependent measure was the percentage of each participant’s own total fixation time allocated to the areas of interest. For each participant, the amount of time spent fixated on each individual area of interest was divided by the time spent fixated anywhere on the image by that participant. This provided a proportion of time allocated to each area of interest based on each participant’s own total viewing time, rather than the total possible viewing time (i.e., 5s). This adjustment was made to account for individual differences in viewing time across participants.
Statistical analyses
Statistical analyses compare performance within groups, rather than across groups. One-way repeated measures ANOVAs, with bar location and as the within subjects independent variable, were conducted for each group. The alpha level for significance was set at .05 (unadjusted for multiple comparisons).
RESULTS


DISCUSSION
To date, very few investigations have examined eye gaze on displays that resemble actual VSDs—with a navigation menu, human figures, and a shared activity. Several important findings concerning general visual attention patterns, irrespective of menu location, warrant consideration. First, participants visually attended to both the main VSD and the navigation menu containing thumbnail sized images of VSDs. Given the visual complexity of these scenes, it was possible that participants may have only attended to one of these elements. For example, they could have become distracted by the small photographs in the menu and failed to attend to the VSD; however, visual attention was allocated to both of these important elements. A second overall consideration is that participants across groups attended to both the children and the shared activity within the VSD, while spending little time on the background elements in the VSD. This suggests that the presence of a natural scene may aid in the processing of the display [8]; however, it does not distract from the meaningful concepts. Attention to the human figures is especially notable for individuals with ASD, who have difficulty directing visual attention toward humans within actual social interactions [9]. Also, eye-tracking work suggests that individuals with ASD may spend less time fixating on humans within natural scenes compared to individuals with TD, particularly when the scene has high social demands (i.e., more than one person) [10]. However, the participants with ASD spent a similar proportion of fixation time on the human elements within the scene as individuals in other groups. This suggests that human figures and a shared activity should be included as key elements within AAC VSDs.
This study suggested that the location of the navigation menu influenced visual attention to the important major elements within the display (main VSD and menu) as well as to the elements within the main VSD (children and shared activity). Therefore, the spatial arrangement of the navigational features of AAC technologies is a design feature that warrants attention, as it may influence how individuals that use AAC attend to and extract information from the display. There are several clinical implications. Placing the menu at the top of an AAC display may be an optimal location to promote attention to human figures, particularly for individuals with ASD. For individuals with DS who show a strong preference for attending to people, we may promote attention to the shared activity by placing the menu on the bottom or left.
One limitation of this study is that small sample sizes limit generality. A second limitation is that this study only measures visual attention upon first exposure, and it does not examine patterns of visual attention over time. Future research should also aim to investigate patterns of eye gaze in more functional, ecologically valid tasks. For example, eye gaze fixation patterns could be evaluated within a task that requires a behavioral response of navigating to a separate page on an actual AAC display. Furthermore, it is important to evaluate viewing patterns within actual communicative interactions using VSDs. These studies should provide valuable information to improve the design of AAC technologies to align with the visual cognitive processing skills of users.
REFERENCES
[1] Beukelman, D., & Mirenda, P. (2013). Augmentative and alternative communication: Supporting children and adults with complex communication needs. Baltimore, MD: Paul H Brookes.
[2] Wilkinson, K. M., & Jagaroo, V. (2004). Contributions of principles of visual cognitive science to AAC system display design. Augmentative and Alternative Communication, 20, 123-136.
[3] Wilkinson, K. M., Light, J., & Drager, K. (2012). Considerations for the composition of visual scene displays: Potential contributions of information from visual and cognitive sciences. Augmentative and Alternative Communication, 28, 137-147.
[4] Wilkinson, K. M., & Light, J. (2014). Preliminary study of gaze toward humans in photographs by individuals with autism, Down syndrome, or other intellectual disabilities: Implications for design of visual scene displays. Augmentative and Alternative Communication, 30, 130-146.
[5] Dunn, L. M., & Dunn, L. M. (2006). Peabody Picture VocabularyTest, 4th edition. American Guidance Service, Minnesota
[6] Charman, T. (2004). Matching preschool children with autism spectrum disorders and comparison children for language ability: Methodological challenges. Journal of Autism and Developmental Disorders, 34, 59-64.
[7] Venker, C. E., & Kover, S. T. (2015). An open conversation on using eye-gaze methods in studies of neurodevelopmental disorders. Journal of Speech, Language, and Hearing Research, 58, 1719-1732.
[8] Oliva, A., & Torralba, A. (2007). The role of context in object recognition. Trends in Cognitive Sciences, 11, 520-527.
[9] Buitelaar, J. K. (1995). Attachment and social withdrawal in autism: Hypotheses and findings. Behaviour, 132(5), 319-350.
[10] Chita-Tegmark, M. (2016). Social attention in ASD: a review and meta-analysis of eye-tracking studies. Research in Developmental Disabilities, 48, 79-93.
ACKNOWLEDGEMENTS
This project was supported, by funding from: (a) U.S. Department of Education grant #H325D110008 and (b) grant #90RE5017 from the National Institute on Disability, Independent Living, and Rehabilitation (NIDILRR).