Assessment of Atypical Motor Development in Infants through Toy-stimulated Play and Center of Pressure Analysis
Susan Zhao1,2,4, Mayumi Mohan4,5, Wilson O Torres1,2,4, Daniel K. Bogen, PhD3, Frances S. Shofer, PhD4, Laura Prosser, PT, PhD6, Helen Loeb, PhD6, Michelle J. Johnson, PhD1-5, Member, IEEE
1University of Pennsylvania, 2Department of Mechanical Engineering and Applied Mechanics, 3Department of Bioengineering, 4Department of Physical Medicine and Rehabilitation, Perelman School of Medicine, 5GRASP Lab, 6Children’s Hospital of Philadelphia
INTRODUCTION
Between 5% and 10% of children suffer from developmental disabilities [1]. These children would benefit
from early diagnosis and motor training interventions as soon as possible, as the opportunity to drive neuroplastic
change decreases as children age [2,3]. However, children who ultimately suffer from motor disabilities like CP typically do not present symptoms severe enough to be recognized by their parents or pediatricians until they are toddlers [4]. The current gold standard for diagnosis, the Bayley Infant Neurodevelopmental Screener (BINS) clinical assessment, misdiagnoses 3-4 out of every 10 infants [3, 5].
There is a need to identify measures and create systems to assess motor development at an early stage. Center of Pressure (CoP) is a quantifiable metric that has been used to investigate postural control in healthy young children [6], children with CP [7], and infants just beginning to sit [8]. It was found that infants born prematurely exhibit different patterns of CoP movement than infants born full-term when assessing development impairments relating to postural control [9]. Preterm infants exhibited greater CoP excursions but had greater variability in their movements than fullterm infants. Our solution, the Play And Neuro-Development Assessment (PANDA) Gym, is a sensorized environment that aims to provide early diagnosis of neuromotor disorder in infants and improve current screening processes by providing quantitative measures rather than subjective ones, and promoting natural play with the stimulus of toys. Previous studies have documented stages in motor development in infants [10, 11], and developmental delays could become more apparent through toy interactions. This study examines the sensitivity of the pressure-sensitive mat subsystem to detect differences in CoP movement patterns for preterm and fullterm infants less than 6 months of age, with varying risk levels. This study aims to distinguish between typical and atypical motor development through assessment of the CoP data of infants in a natural play environment, in conditions where movement may be further stimulated with the presence of a toy.
DESIGN

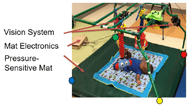
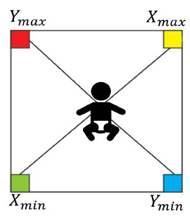
The mat subsystem comprises a load cell on each corner of the mat. The mat platform is a carbon fiber composite with additional padding. The toys and video system are suspended above the mat, with the orangutan and elephant toy positioned above the infant’s chest, and the lion at the infant’s feet. Four force sensors are labeled Green, Red, Yellow and Blue and paired such that the Green and Yellow sensors form an axis as do the Red and Blue sensors (Fig 1). Each pair of sensors relay a signal to an Arduino.
After the system set-up, the mat electronics are connected to a python-generated GUI that is run to collect the raw data from the load cells. Prior to each session, a calibration process is followed using a weight of known mass. This calibration weight is placed on a marker at each corner and the center of the mat. The data from the force sensors are collected in 10 second intervals for each position.
Validation

Precision tests were performed by placing markers in positions on the mat where the x and y position of one marker was measured relative to another. Four trials were performed where a weight was placed on these markers, and we determined the relative distance precision to be 2.21cm.
To determine how accurately a location physically measured on the mat is translated to processed data, we placed weights at measured and marked locations on the mat. Four trials of this experiment were done, each relating to a different mass: 5kg, 7kg, 9kg and 11kg. In both directions, the amount of error and weight were inversely related. In this study, the infants were in the range of 4 to 8 kg, and thus we infer an error range of about 5 to 3.5cm.
METHODS
Participants
For this study, infants were recruited through various methods such as flyers and relationships with daycares and the Neonatal Intensive Care Unit (NICU) at the Children’s Hospital at Philadelphia. The infants exhibited either typical or atypical neuromotor development and were required to be between the ages of 3 and 11 months of age. The parents of the infants provided informed consent approved by the University of Pennsylvania IRB prior to the start of data collection.
Experimental Design
Prior to the trials, a certified therapist administered a BINS assessment to determine the infant’s risk level for atypical neuromotor development. The infant interaction with the PANDA gym consisted of approximately four 2-minute trials, 3 with toys and one without. In some cases, the parent consented to multiple trial sessions, and testing was repeated.
Protocol
For every session, a certified therapist was present to attend to the infant, and the parents could stand or sit beside the gym. The first trial was the “No Toy No Baby” condition where data was collected for two minutes with no weight on the mat. This characterizes the mat and serves as a baseline for its behavior. We positioned the infant to lie supine in the center of the mat (Fig 2). The following trials were collected, all lasting two minutes: No Toy Baby, Elephant, Lion, and Orangutan. The order of the toy trials was randomized and determined prior to testing. If at any point the infant exhibited signs of acute distress, the parent or physician could sooth the infant or take them out of the gym. As a result, the trial would be stopped. The acceptable trials were based on the following criteria: 1. infant was not being touched 2. infant did not cry 3. infant was in a supine position, not rolling, sitting, or crawling, and remained inside the bounds of the mat 4. infant was alert, not showing any signs of sleepiness and 5. data was collected for both No Toy and Toy conditions. These criteria were based on a modified circumplex model of affect [12], where we defined behavior on the valence dimension and movement on the arousal dimension. Trials from 7 fullterm and 6 preterm infants follow these criteria. For this case study, we focus on one fullterm and one preterm infant, and the data is presented below in Table 1.
| Baby ID | Term | Weight (kg) | BINS Score | Risk Factor | BINS Age | Corrected Age |
|---|---|---|---|---|---|---|
| 8 | Fullterm | 5.8 | 10 | Moderate | 5 | - |
| 29 | Preterm | 7.2 | 2 | High | 7 | 5 |
Data Processing
Calibration
We use a Matlab script with the calibration test file and the data file collected during the baby session to transform the raw data into a real-world frame. The script outputs the CoP position of the baby with respect to the location of the four sensors and the bounds of the mat. To achieve this positioning, the calibration data is first processed to determine the range of values from the force sensors that define the four corners of the mat. The data is translated and rotated so the green corner is positioned at (0,0) and the axes are along the x and y axis. The data is scaled first by the weight ratio of the baby’s weight to the calibration weight then in relation to the min and max values from the calibration trial. The data points of the center of pressure of the baby are plotted on a graph that is representative of the baby’s movements in real life.
Analysis


|
ToyType |
MeanCOPMag |
MeanCOPx |
MeanCOPy |
StdDevX |
StdDevY |
No Toy Baby |
8.62 |
0.89 |
2.89 |
0.57 |
1.84 |
Orangutan |
5.60 |
2.04 |
3.79 |
1.26 |
1.12 |
Lion |
3.34 |
1.87 |
4.61 |
2.06 |
2.21 |
Elephant |
3.26 |
1.41 |
2.40 |
1.98 |
1.62 |
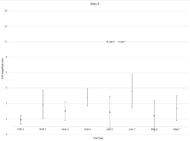
The data collected is analyzed to produce measurements of the following quantities: BabyID, Session Number, Date, Toy Type, Mean CoP magnitude, Mean CoP in the medial-lateral (X) direction, Mean CoP in the caudal-cephalic (Y) direction, Standard Deviation in the X direction, and Standard deviation in the Y direction. CoP is separated in two directions due to significant differences found in previous studies [9], where an infant exhibited much greater CoP excursion in the caudal-cephalic (Y) direction than the medial-lateral (X) direction.
Only timed trials of roughly two minutes –ranging from 100 seconds and up– were filtered out for analysis. If at certain points in the trial the infant began to cry or did not fulfill the criteria of a proper trial, those time segments were removed. The data is then compared against the calibration file, which scales the signals into real world coordinates. To evaluate the max excursion of the CoP in the ml and cc direction, an ellipse is fit to the data, with its major and minor axes corresponding to the greatest distance between two points in a certain direction.
Results
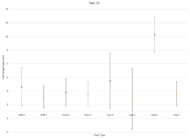
We provide representative data for this study in the form of one dataset of a healthy, fullterm infant, and one dataset of a high-risk, preterm infant.
ToyType |
MeanCOPmag |
MeanCOPx |
MeanCOPy |
StdDevX |
StdDevY |
No Toy Baby |
4.69 |
3.62 |
2.18 |
2.74 |
1.63 |
Orangutan |
4.12 |
2.78 |
2.53 |
2.00 |
1.76 |
Lion |
5.50 |
4.50 |
2.56 |
2.55 |
1.78 |
Elephant |
11.57 |
11.27 |
1.89 |
4.13 |
4.45 |
Discussion
The goal of this study was to determine possible metrics that point to atypical motor development. For the fullterm infant, the magnitude of CoP greatly increased from the No Toy Condition to the Toy Conditions, possibly indicating interest in toys and more interactive movement. A general trend concerned greater CoP magnitude in the Y direction than the X. This points to increased movement involving extension of the legs, which is further seen in the Lion toy trial, as the lion toy is positioned at the infant’s legs and incites kicking motions. The preterm infant exhibited greater CoP in both directions, and more variability overall. There was a lower CoP magnitude in the Toy condition for Orangutan and Lion toys than in the corresponding No Toy Condition, indicating either a disinterest in the toys or an inability to interact with them. The elephant trial elicited large medial-lateral movements, indicating a possible roll.
Limitations
By assessing these characteristics of the mat, we are conscious of the limitations of this system. A considerable limiting factor is the maximum weight the system can experience while still operating as expected. The age range of infants in this study go up to 11 months, and it is in the 7 to 11-month age group where infants begin to exceed 9kgs in weight. In these trials the mat system produced unusual data containing unrealistic and large fluctuations in CoP magnitude. We hypothesize that the weight of the older infant coupled with the weight of the gym exceeded the limits of our system, and thus have excluded the trials where infant weight exceeded 9kgs. We look towards further assessing the mat limitations for more successful future trials.
Future Directions
This system aimed to reproduce the findings in a previous study performed by Dusing et al, and assess the CoP metric alongside the presence of toys. Previous hypotheses [9] was supported, where preterm infants exhibit larger CoP magnitude but greater variability, and infants exhibit larger CoP in the caudal-cephalic (Y) direction than the medial-lateral (X) direction. There are many more datasets to analyze, but this case study has provided a basis to move forward. We hope to generate more concrete conclusions with a greater sample size.
REFERENCES
- Rydz, D. and M. Shevell, A. Majnemer, and M. Oskoui. 2005. “Developmental Screening.” Journal of Child Neurology. 20 (1): 4-21.
- I. Novak, S. McIntyre, L. Campbell, L. Dark, N. Morton, E. Stumbles, S. Wilson, and S. Goldsmith. 2013. “A Systematic Review of Interventions for Children with Cerebral Palsy: State of the Evidence.” Developmental Medicine & Child Neurology. 55 (10): 885-910.
- Leonard, C., R. Piecuch, and B. Cooper. 2001. “Use of the Bayley Infant Neurodevelopmental Screener with Low Birth Weight Infants.” Journal of Pediatric Psychology. 26 (1): 33-40.
- Gucuyener, K., E. Ergenekon, A. Soysal, A. Aktas, O. Derinoz, E. Koc, and Y. Atalay. 2006. “Use of the Bayley Infant Neurodevelopmental Screener with Premature Infants.” Brain Development. 2: 104-108.Rosenbaum, P., S. Walter, and S. Hanna. 2002. “Prognosis for Gross Motor Function in Cerebral Palsy: Creation of Motor Development Curves.” Journal of the American Medical Association. 288 (11): 1357-1363.
- Aylward, G. and S. Verhulst. 2000. “Predictive Utility of the Bayley Infant Neurodevelopmental Screener (BINS) Risk Status Classifications: Clinical Interpretation and Application.” Developmental Medicine and Child Neurology. 42: 25-31.
- Riach CL, Hayes KC Dev Med Child Neurol. 1987 Oct; 29(5):650-8.
- Cherng RJ, Su FC, Chen JJ, Kuan TS Am J Phys Med Rehabil. 1999 Jul-Aug; 78(4):336-43.
- S. C. Dusing, A. Kyvelidou, V. S. Mercer, and N. Stergiou, “Infants born preterm exhibit different patterns of center-of-pressure movement than infants born at full term,” Physical Therapy, vol. 89, no. 12, pp. 1354– 1362, oct 2009.
- Kyvelidou, A., Harbourne, R. T., Shostrom, V. K., & Stergiou, N. (2010). Reliability of Center of Pressure Measures for Assessing the Development of Sitting Postural Control in Infants With or at Risk of Cerebral Palsy. Archives of Physical Medicine and Rehabilitation, 91(10), 1593–1601.
- Galloway, J. C., & Thelen, E. (2004). Feet first: object exploration in young infants. Infant Behavior and Development,27(1), 107-112. 2003.06.001
- Thelen, E., Corbetta, D., & Spencer, J. P. (1996). Development of reaching during the first year: Role of movement speed. Journal of Experimental Psychology: Human Perception and Performance, 22(5), 1059-1076. doi:10.1037/0096-1523.22.5.1059
- Posner, J., Russell, J. A., & Peterson, B. S. (2005). The circumplex model of affect: An integrative approach to affective neuroscience, cognitive development, and psychopathology. Development and Psychopathology, 17(3), 715–734.
ACKNOWLEDGEMENTS
This study was supported by the National Institute of Health R21 HD084327-01 grant, NSF Louis Stokes Alliances for Minority Participation Grant, CURF Vagelos Undergraduate Research grants. We would also like to acknowledge Wilson Torres, Sofiya Lysenko, Sam Gaardsmoe, Roshan Rai, Vatsala Goyal, Sakthivel Sivaraman, Shreyas Skandan, Megan Johnson, Nicole Fregnene, Elaida Dimwamwa, Sindura Chaparala, Rohini Kopparam, Danielle Rubin for their contributions to the project.