M. Reilly1,2, K. Kontson2
1University of Maryland, Department of Biomedical Engineering, College Park, MD
2 U.S. FDA, Center for Devices and Radiological Health, Office of Science and Engineering Laboratories, Division of Biomedical Physics, Silver Spring, MD
INTRODUCTION
Individuals with upper limb amputation experience twice the prevalence of Musculoskeletal Complaints (MSCs) compared to the general population [1]. MSCs are closely associated with decreased physical and mental health. The areas of the body most affected by MSCs in the upper limb amputee population include the affected limb, non-affected limb, and the back and neck [1, 2]. While there is evidence to show the correlation between physically demanding tasks and MSCs, a more focused kinematic evaluation of the movements employed by the upper limb prosthesis user population that lead to MSCs has not been performed.
MSCs can be attributed to over use of the intact arm, repetitive motions, and compensatory movement due to reduced degrees of freedom (DOFs) when using a prosthetic device. Compensatory movements can be defined as movements used habitually to achieve functional motor skills when a normal movement pattern has not been established or is unavailable [3]. There are several studies that show the degree of compensatory movement in the shoulder and torso for upper limb prosthesis users [4-6], but none that link those movements to the MSCs observed in this population. Assessment of how these motions directly impact the body can only be inferred from the motion. As a result, conclusions based on kinematic information alone cannot asses specific muscle forces and joint reactions within the body. To determine the effect that reduced DOFs have on compensatory movement and how those compensatory movements affect muscle activation and joint kinetics, we performed a musculoskeletal computational analysis of able-bodied individuals performing an object transport task using a generic upper body musculoskeletal model from AnybodyTM. Musculoskeletal modeling is useful for estimation of internal loading on the human skeleton and muscles, and has been used to model both upper and lower limbs [7, 8].
In the presented study, participants performed the object transport task under normal conditions, and under a restrained condition which reduced the DOFs in the hand/wrist in order to elicit compensatory movements. 3D motion capture data were collected as participants performed each task. Kinematic data and anthropometric measurements were collected for each subject, and used to inform an upper body musculoskeletal computational model created in Anybody Modeling System Software. The forces and moments created in the joints and muscles were determined from the movement and weight of the subject, and compared between conditions.
METHODS
Subjects
Kinematic data were collected from three individuals (age/sex: 30/F, 22/M, 24/F) with no upper limb disability using a motion capture system. All subjects were right hand dominant. The study was approved by the Institutional Review Board (Research Involving Human Subjects Committee) of the U.S. Food and Drug Administration (RIHSC #14-086R). All subjects provided written informed consent prior to participating in the study.
Kinematic Data Acquisition
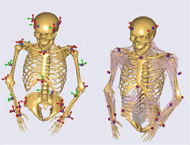
Twenty-eight retro-reflective markers were placed on each subject’s head, torso, arms, and pelvis. These markers were then tracked in three-dimensional space using eight optical ViconTM Bonita B10 cameras at a sampling rate of 150 Hz while subjects performed a specific task.
The task analyzed in this paper is the targeted Box and Blocks Test (tBBT) [9]. This task involves moving 16 blocks arranged in a 4 × 4 array from one side of a partition to another. Each block must be lifted individually over a partition, and placed in a corresponding location on a 4×4 array on the opposite side. Each subject first performed this task with their dominant hand. Subjects then performed the task again with the DOFs of the hand restricted through bracing and taping. A wrist brace was secured around the subject’s dominant hand to limit wrist flexion/extension and ulnar/radial deviation. Thumb, ring, and small fingers were wrapped to a “closed” position; index and middle fingers were each wrapped to reduce the possible flexion at the proximal and distal interphalangeal joints.
The output file from each subject’s motion capture session containing the XYZ locations of each retro-reflective marker was used as input to the upper body musculoskeletal computational model in AnyBody Modeling SystemTM software (AnyBody Technology, Aalborg, Denmark; version 6.0.6).
Upper Body Musculoskeletal Model


Once kinematic optimization was completed, muscle activity and joint forces were computed using an inverse dynamics approach by minimizing the sum of muscle activities (Eq. 1) [11]. Because the body has more muscles than necessary to balance degrees of freedom, physiological assumptions for muscle recruitment must be made. Muscle activities are defined as the normalized muscle force, with a normalization factor assigned to each muscle based on the relative strength of that muscle [11]. The force exertion in the muscles and reaction forces in the joints are determined based on the external load and inertial forces. In Eq. 2, C is the coefficient-matrix for the unknown forces, f represents the unknown muscle and joint forces, and r contains all known applied loads and inertia forces [11]. For the current study, the external load was calculated using the kinematic motion, provided by the kinematic optimization test, and the weight of each body segment. Calculations were performed at each capture frame.
(Eq. 1)
(Eq. 2)
Data Analysis

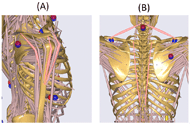
Seven different muscles were analyzed: posterior, central, and anterior right deltoid; right and left erector spinae (ES) extending down the spine from the 2nd thoracic vertebra to 2nd lumbar vertebra; and right and left upper trapezius (TS) extending from 2nd cervical vertebra to acromion. Figure 2 shows these muscle groups highlighted in red on the AndyBody model. For the current study, only data from the first block being transported over the partition are shown.
RESULTS


CONCLUSIONS
Although data from only a single subject are presented, preliminary results suggest there is an increase in muscular forces generated in the upper arm, back, and neck when the distal DOFs in the arm are reduced. These results are consistent with the areas on the body most commonly identified as MSCs in the upper limb amputee population [1]. In Figure 5, the braced condition forces appeared larger with more rapid changes in forces, showing an increase in the trunk and neck forces due to compensatory movements employed by the subject as a result of the reduced DOFs in the wrist/hand. The difference was largest around the moment of block placement, where kinematic trajectory deviation between normal and braced conditions was greatest. Under braced conditions, the forces generated in the right deltoid were generally lower compared to the normal condition, even though the shoulder abduction and flexion angles were greater. Additional analysis of the arm movement under both conditions is required to better understand this result (e.g., hand acceleration under both conditions). While model processing helped to reduce the amount of kinematic error between markers defined in the model and markers tracked on the subject during the experiment, there is still inherent error in the measurement of the markers in the experiment due to soft tissue artifact. This is the error caused by the movement of skin independent to the movement of the skeleton [12]. A larger sample size is required in order to verify these preliminary results. Future studies will focus on analyzing a broader array of muscles while able-bodied subjects perform other functional tests, and also on the inclusion of upper limb amputee subjects using body-powered prostheses to assess the effect of terminal device manipulation on the musculature.REFERENCES
[1] Postema SG, Bongers RM, Brouwers MA, Burger H, Norling-Hermansson LM, Reneman MF, et al. Musculoskeletal Complaints in Transverse Upper Limb Reduction Deficiency and Amputation in The Netherlands: Prevalence, Predictors, and Effect on Health. Arch Phys Med Rehabil. 2016;97(7):1137-45.
[2] Bouma SE, Postema SG, Bongers RM, Dijkstra PU, van der Sluis CK. Musculoskeletal complaints in individuals with finger or partial hand amputations in the Netherlands: a cross-sectional study. Disabil Rehabil. 2017:1-8.
[3] compensatory movement: Medical Dictionary for the Health Professions and Nursing. 2012:[Available from: https://medical-dictionary.thefreedictionary.com/compensatory+movement.
[4] Hebert JS, Lewicke J. Case report of modified Box and Blocks test with motion capture to measure prosthetic function. Journal of Rehabilitation Research & Development. 2012;49(8):1163-74.
[5] Major MJ, Stine RL, Heckathorne CW, Fatone S, Gard SA. Comparison of range-of-motion and variability in upper body movements between transradial prosthesis users and able-bodied controls when executing goal-oriented tasks. Journal of neuroengineering and rehabilitation. 2014;11:132.
[6] Metzger AJ, Dromerick AW, Holley RJ, Lum PS. Characterization of compensatory trunk movements during prosthetic upper limb reaching tasks. Archives of physical medicine and rehabilitation. 2012;93(11):2029-34.
[7] Garner BA, Pandy MG. Musculoskeletal model of the upper limb based on the visible human male dataset. Comput Methods Biomech Biomed Engin. 2001;4(2):93-126.
[8] Xu C, Silder A, Zhang J, Hughes J, Unnikrishnan G, Reifman J, et al. An Integrated Musculoskeletal-Finite-Element Model to Evaluate Effects of Load Carriage on the Tibia During Walking. J Biomech Eng. 2016;138(10).
[9] Kontson K, Marcus I, Myklebust B, Civillico E. Targeted box and blocks test: Normative data and comparison to standard tests. PLOS ONE. 2017;12(5):e0177965.
[10] AnyBody. AnyBody Body Model 2017. Available from: https://github.com/AnyBody/support/wiki/AnyBody-Body-Model.
[11] Damsgaard M, Rasmussen J, Christensen ST, Surma E, de Zee M. Analysis of musculoskeletal systems in the AnyBody Modeling System. Simulation Modelling Practice and Theory. 2006;14(8):1100-11.
[12] Zhang Y, Lloyd DG, Campbell AC, Alderson JA. Can the effect of soft tissue artifact be eliminated in upper-arm internal-external rotation? J Appl Biomech. 2011;27(3):258-65.
Acknowledgements
The authors would like to thank Sophie Wang and Laura Wozniczka for help with data acquisition. The work was supported by funding from the U.S. FDA’s Critical Path Initiative and by appointments to the Research Participation Program at the CDRH administered by the Oak Ridge Institute for Science and Education through an interagency agreement between the U.S. Department of Energy and the U.S. FDA.
Disclaimer: The mention of commercial products, their sources, or their use in connection with material reported herein is not to be construed as an actual or implied endorsement of such products by the Department of Health and Human Services.