The evaluation of automated methods for analyzing communication rate in Augmentative and Alternative Communication (AAC)
ABSTRACT
Automated Data Logging is a computerized technique used to create a continuous log of human and machine activity generated by an augmented communicator with their communication device. With a digitally stored logfile, it is possible to produce an automated analysis data logs (AADL) of different performance measures such as communication rate, keystroke efficiency, etc. This paper reports on a preliminary evaluation of the efficacy of an AADL procedure for measuring the communication rate of data logs obtained from augmented communicators using their devices during daily communication activities.
BACKGROUND
A significant impediment for the clinical use of objective, data-based performance measures in the AAC field is related to the time, effort and technology required to collect and analyze user-machine interactions and augmented speaker communication. Over the last several years advances have been made in automating some of these tasks1,2,3,4.
With the advent of computer-based augmentative and alternative communication (AAC) devices it is possible to automatically collect data on many aspects of user device performance. Automated Data Logging is a computerized technique used to create a continuous log of machine activity generated by an augmented communicator. Through the use of data logging, the AAC device creates a continuous record of communicator and machine activity - anywhere and anytime (home, work, at the movies, etc). Data analysis can be facilitated because data logs are in a machine-readable format which can be analyzed by a computer program. Currently, ADL capabilities are available on devices produced by several manufacturers.
Although logfile capabilities are beginning to appear on AAC technologies, there are no clinical tools that provide an automated analysis of data logs (AADL). Currently, logfile data must be analyzed manually by the clinician or researcher, through a transcription service, or via the Augmentative Communication Quantitative Analysis (ACQUA) research tool developed by the RERC on Communication Enhancement (AAC-RERC)1,5.Although ACQUA provides a computerized solution for AADL, it is designed as a research tool and doesn't provide the quick, simple turnkey approach to data analysis needed by clinicians for evaluation and planning.
AADL is further complicated by the logfile data produced during daily communication activities. Raw logfiles may contain frequent misspellings, run-on and partial words, and pause time information associated with message generation. The effect of this kind of data on the measurement of speed, efficiency and linguistic performance has yet to be determined. Filtering algorithms need to be developed that free the clinician from manual inspection of the data, yet provide valid performance measures.
RESEARCH QUESTION
The objective of this study was to determine whether a valid AADL filtering solution could be found to calculate communication rate from logfiles created by AAC users during the course of their daily communications. The provision of such a measure would represent a significant step forward in transitioning automated data logging from a research method to a clinical technique.
METHOD
The logfiles used in this study were obtained from three augmented speakers who participated in a one month evaluation of an AAC device funded by the National Institutes of Health - NCHHD. Two data logs were selected from each subject's data base from that period of time. The logfiles represent unconstrained communication activities produced sometime during the course of the study. Specifics on logfiles and logfile analysis techniques have been documented by the authors. Subject and logfile statistics are shown in Table 1.
RESULTS & DISCUSSION
 |
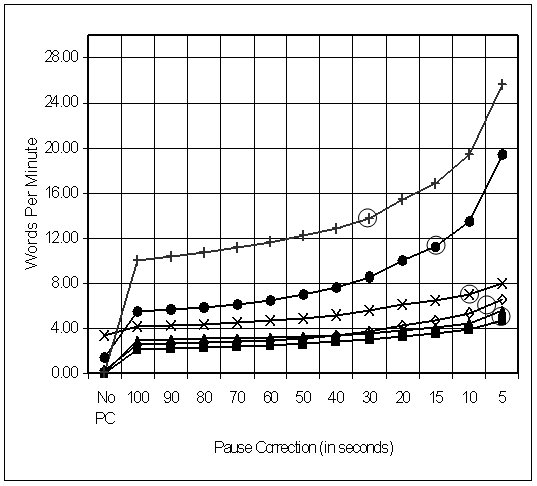 |
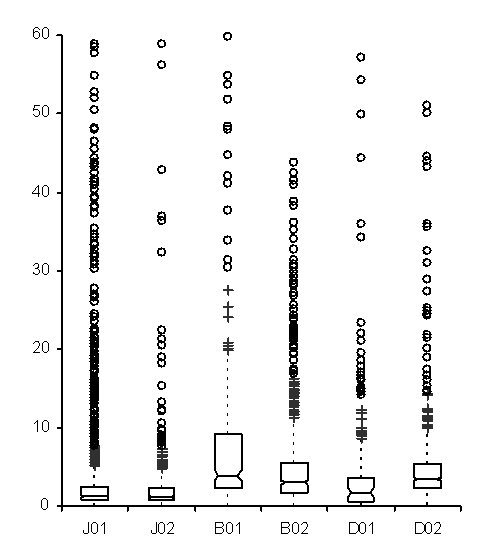
As shown in Figure 1, the median pause times between device selections for subjects ranged between 1 and 4 seconds and the data distributions were highly skewed, reflecting pauses between utterances, downtime between device use, etc. Figure 2 shows the effect of filtering or removing pauses of specified durations on the calculation of device production rate (i.e., words per minute). When no pause time correction is applied, communication rates are all under 4 words per minute. A sharp increase in communication rate is observed when filtering out selections greater than 100 seconds, with a consistent increase in communication rate as filtering is successively applied to the selection data. However it is problematic to apply a uniform pause correction because the distributional characteristics of each dataset differ significantly. For instance, filtering out selection times above 10 seconds would affect less than 10 percent of the data for J01, J02, D01 & D02, but eliminate 12 - 20 percent of the data for B01 & B02. It may be more practical to apply filtering based on the distributional characteristics of each logfile. The open circle symbols in Figure 2 show differences in individual the communication rates and pause times when filtering at a specific percentile point (90th). Another solution (not shown here) is to substitute a default pause time for selection datapoints that exceed a specific latency threshold.
REFERENCES
- Higginbotham, D.J., Lesher, G.W., Moulton, B.J. & Rinkus, G.J. (1992). Automated Data Logging in Augmentative Communication. To appear in J. Winters, C. Robinson, R. Simpson, G. Vanderheiden, Eds.), Emerging and Accessible Telecommunications, Information and Healthcare Technologies - Engineering Challenges in Enabling Universal Access. Arlington, Resna Press
- Lesher, G.W., Rinkus, G.J., Moulton, B.J., & Higginbotham, D.J. (2000). Logging and Analysis of Augmentative Communication. Proceedings of the RESNA 2000 Annual Conference, 82-85.
- Hill, K. & Romich, B. (2001). A language activity monitor for supporting AAC evidenced-based clinical practice. Assistive Technology, 15, 12-22.
- Hill, K. (2001). The development of a model for automated performance measurement and the establishment of performance indices for augmented communicators under two sampling conditions. Unpublished unpublished doctoral dissertation., University at Pittsburgh, Pittsburgh.
- Current research and software for logfile analysis can be found on the Communication Performance Assessment page of the AAC-RERC website ( http://aac-rerc.com/pages/performance.html ).
ACKNOWLEDGMENTS
This study was funded by the National Institute on Disability under grant # H133E980026-01 and the National Institute on Maternal and Child Health and Human Development under grant # 2R44 HD33961 02A1.
Contact
D. Jeffery Higginbotham,
Communication and Assistive Device Laboratory
Department of Communicative Disorders and Sciences
University at Buffalo
Buffalo, NY 14214
716-998-9009, cdsjeff@buffalo.edu