Paper Title: REMOTE REHAB-AT-HOME (rRAH): VIRTUAL REALITY SYSTEM FOR PROMOTING HOME CARDIAC REHABILITATION
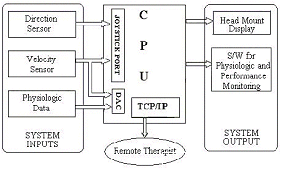
The key components of the system hardware are a Pentium-based PC, minimum of 64 MB RAM, a velocity sensor, a direction sensor, DAC card, HMD and a PC joystick port as shown in Figure 1.
Technically PC-based rRAH system converts bicycle to an ultimate 2-axis, 2-button joystick. A D-sub type 15-pin connector on the game port serves as the interface between the bicycle and the PC. The outputs of the velocity and the direction sensor from the bicycle serve as system inputs to the joystick port. Another set of system inputs is the physiologic data collected from the sensors attached to the patient and fed to the data acquisition card. The output of the velocity sensor will also be fed to the data acquisition card for exercise performance data measurements. The prototype architecture is shown in Figure 1.
The system outputs visualized on the HMD will be the virtual environment and the graphic user interface displaying the physiologic and exercise performance data. This user-centered data can be transmitted via TCP/IP to the clinician for remote consultation.
FIGURE 2
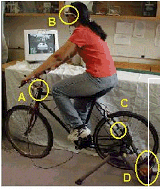
In addition, to minimal system requirements mentioned above, the system requires a rear wheel support assembly for converting a conventional bicycle into a stationary exercise unit, a resistance or tension generator to vary workload for the user, a signal conditioning unit for feeding velocity sensing input to the joystick port as well as to the DAC card, a front wheel mount assembly for interfacing direction sensor to steering handle mechanism, a dual display card for installing HMD, the software for displaying user data and a set of virtual environments. Figure 2.1 depicts the sketch of the rRAH bicycle system hardware.
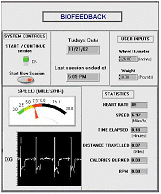
System software is shown in Figure 2.2. The virtual environment, the physiologic data, and the exercise performance data are the end products of system software displayed to the user. They will be used as a biofeedback tool in keeping the patient motivated. Sensors from the rRAH hardware module as well as from the user will be fed to the PC via DAC card and will be used to generate exercise performance and physiologic data displays respectively. The data collected also may be transmitted to the remote therapist for consultation and performance-based evaluation. The researchers propose to use LabView (National Instruments; Austin, TX) as their software tool.
The exercise data includes display of average speed (Miles/hr), Distance (Miles), Time of exercise, Energy expenditure (Calories), Workload level (Percentage). The performance data includes display of target heart rate range to maintain an aerobic exercise protocol and body mass index calculated from user input parameters like age, height and weight. The front panel display can not only be observed by the remote clinician, but the clinician can also request control of the display panel remotely.
One of the signals the system acquires will be from the velocity sensor. The internal system clock will be monitored to calculate the time elapsed. From the outputs of the velocity sensor, a counter is initialized and is incremented each time the sensor is activated. The product of the counter value and the circumference of the bicycle wheel gives the distance covered (miles). This measure will then be divided by the time elapsed to calculate the pedaling speed (miles/hr). Dividing the counts by the time elapsed provides revolutions per minute (RPM). Energy expenditure during the course of exercise can be calculated in three ways. The first method, which the researchers propose to use, is metabolic equivalents (METs) to calculate energy expenditure in calories; a commonly used measure for energy expenditure. This relationship is shown in Equation 1. The MET values corresponding to the oxygen consumption depending on the pedaling speed are provided in the lookup Table 2.
E = 3.5/200 x METs x T x W...................................................Equation 1
Where E is energy expenditure (kcal), resting VO2 (One MET) = 3.5 ml/kg/min, T is time (minutes), W is bodyweight (kg)
Table 1: MET values for different speed levels
The second method is to calculate power in watts, which is dependent on the cycling speed (V in m/s), user mass (m in kg), upslope (s in percentage), acceleration of the bicycle (a in m/s2) and the gravitational acceleration (g = 9.806 m/s2), shown in Equation 2 [43].
E = V (3.509 + 0.2581 v2) + 10.32 m (s/100 + 1.01a/g) x T/ 69.78................Equation 2
However, this technique is not dependent on the users oxygen consumption levels, hence was rejected.
A third technique to estimate the energy expenditure is in terms of heart rate (Equation 3). A relationship between heart rate and oxygen consumption can be developed from a review of the literature.
E = 5V02 x W x T.................................................Equation 3
As 1 liter of O2 is equivalent to 5 kilocalories. An alternate method utilizes an efficiency index calculated from heart rate, i.e. physiologic cost index (PCI) and total heart beat index (THBI). PCI by MacGregor's formula is (HRss - HRr)/V, where, HRss average steady state working heart rate and HRr is average resting heart rate and TBHI is a ratio of the total heartbeats and the distance traveled. The researchers of this project chose (Equation 1) MET values to calculate energy expenditure as the relationships shown in Equations 2 & 3 requires more calibration and customization and are not user friendly. In addition, the relationships are poorly correlated during periods of light activity or rest.
The heart rate is the physiologic parameter measured. Sensors attached to the user extract the ECG signal from the user in lead I configuration. Heart rate is extracted from the ECG signal by incorporating a QRS detector. A counter is initiated and incremented at every QRS complex occurrence for a period of 4 seconds. Knowing the counter value for a period of 4 seconds, the count for a period of 60 seconds is calculated, which gives the heart rate. Body weight is manually entered after measuring on a weight scale.
The system should also set target levels for the patient to achieve as biofeedback. Target heart rate will be calculated dependent on the patient's age and will be provided for the user to achieve as shown in Equation 4 and 5.
Age adjusted maximum heart rate (AAMHR) = 226 -Age (Males).............. Equation 4
= 220- Age (Females)..........Equation 5
Minimum and maximum target heart rate range will be set between 35 % and 90% of AAMHR. The software routine should not only provide this information to the user, which serves as the biofeedback, but also to the clinician for remote consultation. Thus, performance based evaluation, and supervised at-home rehabilitation will be achieved.


