VISIBLE AND NEAR-INFRARED SPECTROSCOPY: A PROMISING NEW TOOL FOR PRESSURE ULCER DIAGNOSIS
ABSTRACT
Stage I pressure ulcers are difficult to diagnose, particularly in individuals with dark skin. Recent literature suggests that visible and near-infrared spectroscopy can assess tissue oxygenation regardless of skin pigmentation. The intent of this paper is to build an argument for the use of spectroscopy to diagnose pressure injury. We will introduce the reader to spectroscopy theory and instrumentation, review recent literature, and suggest future directions for research exploring spectroscopy as a safe, effective, and non-invasive method of assessing pressure injury.
BACKGROUND AND STATEMENT OF PROBLEM
Stage I pressure ulcers are difficult to diagnose, particularly in individuals with darkly-pigmented skin [1]. The erythema associated with stage I pressure ulcers is masked to our eye by melanin, as is the blanch response (or lack of blanch) observed when firm finger pressure is applied to the skin. Changes in skin temperature, tissue consistency, or sensation can also be used as indicators of pressure damage. However, a number of factors make these indicators unreliable in clinical settings, including the use of examination gloves, fluorescent lighting, or a patient's impaired cognitive status [1]. Early pressure damage that remains undiagnosed may progress to higher stage ulcers that are more difficult to heal. Clearly, an accurate and reliable means of diagnosing pressure ulcers is needed, preferably one that is safe, non-invasive, and effective regardless of skin color.
SPECTROSCOPY AS A POSSIBLE SOLUTION
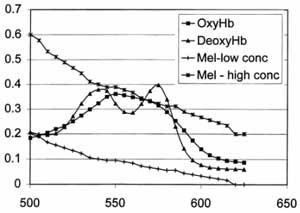
Spectroscopy theory and instrumentation. Skin contains a number of light-absorbing species, or chromophores, including melanin in the epidermis and hemoglobin (HbO2) and deoxyhemoglobin (Hb) in the vessels of the dermis. When exposed to light energy, each of these molecules absorbs certain wavelengths of light and reflects others, producing a spectrum that uniquely identifies that chromophore. Both visible (400-700nm) and near-infrared (700-2500nm) light can be used safely to obtain spectra from chromophores in skin. Light in these ranges is non-ionizing, and falls below the mid and far infrared wavelengths capable of causing superficial thermal injury to skin [2]. HbO2 and Hb show distinct absorption peaks in the visible (VIS) and near-infrared (NIR) regions, allowing these tissue consitutents to be readily identified (see figure). Spectra in the NIR ranges are minimally affected by melanin, whose absorbance is negligible in this region [3]. In addition, NIR light is able to travel to deeper tissue layers before being absorbed, penetrating to depths of several centimeters [3]. Thus, VIS-NIR light can be safely used to identify and quantify multiple tissue constituents at a variety of skin depths.
 |
Use of spectroscopy to measure oxygenation. VIS-NIR spectroscopy has successfully measured tissue oxygenation in a variety of studies of human subjects. VIS-NIR spectroscopy measurements followed real-time changes in oxygenation and blood content resulting from venous and arterial occlusion in the forearm[6]. It has also been used to monitor reactive hyperemia in the feet of subjects with peripheral vascular disease[7], cerebral oxygenation during cardiac surgery[6], and muscle oxygenation during exercise [6].
Application to pressure ulcer diagnosis. VIS-NIR spectroscopy has been successfully used to detect a blanch response in lightly and darkly pigmented skin. Matas and colleagues exposed skin on the dorsal forearms of light and dark-skinned healthy subjects to high (50 mmHg) and low (1 mmHg) pressures, while recording diffuse reflectance[5]. Spectra in the ranges of 520nm-610nm and 740nm-820 nm were curve fit to known absorbance spectra for melanin, HbO2 and Hb to determine the relative concentrations of each chromophore in the tissue sampled. Total hemoglobin (HbO2+ Hb), a measure of blood content, was calculated and compared between high and low pressure in both pigmentation groups. With pressure application, a significant decrease in total hemoglobin was identified in both the light and dark-skinned groups, consistent with the displacement of blood from surface vessels exposed to pressure. These results confirm that a blanch response can be “seen” with spectroscopy even when no visible color changes are identified with visual inspection.
Another recent study indicated that
erythmatic sites can be distinguished from non-erythmatic
sites with acceptable levels of reliability, sensitivity,
and specificity using a variety of detection algorithms.
Riordan and colleagues induced erythema near the tibial
plateau of normal
subjects[4]. Repeated reflectance measurements were taken
at the erythmatic site and two adjacent control sites under
low pressure (<40 mmHg) and high pressure (150mmHg).
Sensitivity of erythema detection was determined by comparing
the erythmatic site (true positive site) to the control
sites (true negative site). Specificity was determined by
comparing the control sites. The investigators found strong
reliability for five of the seven algorithms tested (ICC
0.80-0.99). Sensitivity of erythema dectection in dark-skinned
subjects ranged from 0.74 to 0.90, and specificity ranged
from 0.64 to 0.91. These results indicate that multiple
data processing algorithms can be successfully used to assess
erythema in dark skin.
IMPLICATIONS FOR FUTURE WORK
While researchers have only recently begun to use spectroscopy to assess skin exposed to pressure, early results are promising. Several clinically relevant research questions are waiting to be answered. How effective is spectroscopic skin assessment in individuals at risk for pressure ulcers? Is spectroscopic skin assessment more effective than traditional skin inspection in diagnosing early stage pressure ulcers in dark skin? Does early pressure ulcer diagnosis using spectroscopy affect clinical outcomes? In addition to Stage I diagnosis, spectroscopy can be used to investigate the response of deep tissue structures to pressure. Spectroscopic imaging, which provides a 2-D spectral picture of tissue, can also be employed as a tool for assessing wound development and healing. Future studies could also use other biological chromophores, such as water and cytochrome aa3, as non-invasive measures of tissue health. Clearly, spectroscopy has the potential to become a critical measurement tool in the future.
REFERENCES
-
Henderson, C.T., et al., Draft definition of stage I pressure ulcers: inclusion of persons with darkly pigmented skin. NPUAP Task Force on Stage I Definition and Darkly Pigmented Skin. Advances in Wound Care, 1997. 10(5): p. 16-9.
-
Duchene, A.S., J.R.A. Lakey, and M.H. Repacholi, eds. IRPA Guidelines on Protection Against Non-Ionizing Radiation: The Collected Publications of the IRPA Non-Ionizing Radiation Committee. 1991, Pergamon Press: New York.
-
Sowa, M.G., et al., In vivo tissue analysis by near-infrared spectroscopy, in Encyclopedia of Analytical Chemistry, R.A. Meyers, Editor. 2000, John Wiley and Sons, Ltd.: Chichester. p. 251-281.
-
Riordan, B., S. Sprigle, and M. Linden, Testing the validity of erythema detection algorithms. Journal of Rehabilitation Research and Development, 2001. 38(1): p. 13-22.
-
Matas, A., et al., Eliminating the issue of skin color in assessment of the blanch response. Advances in Skin & Wound Care, 2001. 14(4): p. 180-8.
-
Shaw, R.A., et al., In vivo optical/near-infrared spectroscopy and imaging of metalloproteins. Journal of Inorganic Biochemistry, 2000. 79(1-4): p. 285-93.
-
Kragelj, R., et al., Parameters of postocclusive reactive hyperemia measured by near infrared spectroscopy in patients with peripheral vascular disease and healthy volunteers. Annals of Biomedical Engineering, 2001. 29: p. 311-320.