SOUND LOCALIZATION TECHNIQUES FOR A DIRECTION INDICATING VIBROTACTILE AID
ABSTRACT:
This study evaluated two methods of determining sound direction for use with a direction indicating vibrotactile aid (DIVA). The DIVA is a device designed to indicate the presence of sound and its direction relative to the user. A cross-correlation method determined phase delay between the two microphone signals in order to determine the time delay of the sound reaching the microphones. A VRMS method determined the root-mean-square voltage of each signal in order to determine the relative intensity of the signals at the microphones. Each method was tested in a soundproof room at several different angles relative to the sound source. The VRMS method was more reliable than the cross-correlation in the soundproof lab, but neither method was reliable when tested in a room with echoes and background noise.
Deaf and deaf/blind individuals, specifically those with binaural, asymmetrical, or profound hearing loss, have poor sound-localization ability and are unable to monitor and respond to environmental noises (1). Deaf individuals would benefit from an improved ability to localize events in the environment such as an approaching car, a ringing telephone or a siren. Additionally, individuals who rely on lip-reading would benefit from an ability to quickly locate a speaker.
There are many different sound-signaling devices that offer alternatives to traditional hearing-based technologies. Caption decoders for the television, teletype machines for the telephone, flashing door knockers, flashing smoke detectors, baby cry signalers and flashing, vibrating alarms can all make living with deafness less of a challenge. In addition to these technologies, devices such as hearing aids, cochlear implants and the Symphonix®sound bridge (Siemens, Germany) are used to amplify and utilize residual hearing. Vibrotactile aids such as Tactaid® (Audiological Engineering Coorp., Somerville, MA) and Fonator® (Fonator AB,Sweeden), are also available, but these are used to provide information about the speech frequency and duration (2).
Previous studies by Richardson (3), and Weisenberger (4) have implemented sound localization using vibrations on the skin. In Richardson's study, the subjects were required to judge the relative strength of vibrations placed on their palms. DIVA's purpose is to signal the direction using an array of three vibrators, rather than requiring the user to judge the vibration strength.
RESEARCH QUESTION:
The research tested the ability of two methods, VRMS and cross-correlation to reliably indicate sound direction.
METHODS:
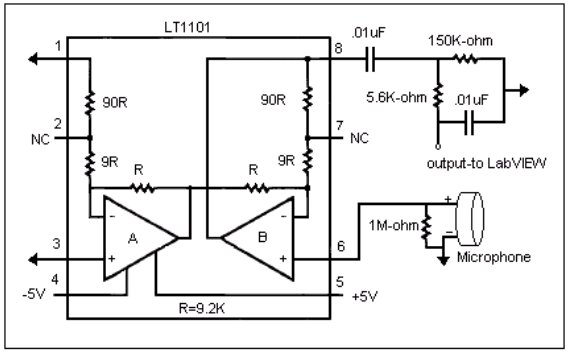
The microphone circuit consists of a crystal microphone and an instrumentation amplifier [Figure 1]. A coaxial cable connected the microphone to the amplifier in order to improve the signal to noise ratio.
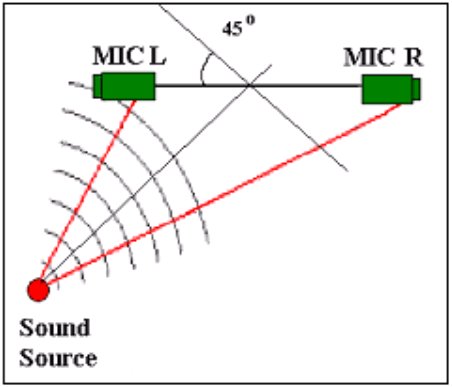
The microphone circuit was soldered to a breadboard and mounted to a fixture. The microphones were spaced 21 cm apart and placed at an 180o angle relative to one another. This orientation increased the time delay and intensity difference between signals. At an angle of 90 degrees relative to the sound source the theoretical maximum time delay between the microphones is calculated to be 0.61ms. The circuit and software were first evaluated in a sound proof room at an approximate distance of one meter from the sound source. Three sounds were used to test the methods: A person softly saying "hello", a car horn honking, and a siren. Each clip was played three times at each of six angles. The microphones were tested at angles of 0, 10, 30, 45, 60 and 90 degrees relative to a fixed sound source [Figure 2]. The analog signals were acquired on a PC using a DAQPAD (National Instruments, Austin, TX) at a sampling rate of 10KHz. The LabVIEW(National Instruments, Austin, TX) program was used for analysis and processing of the signals.
 |
 |
RESULTS:
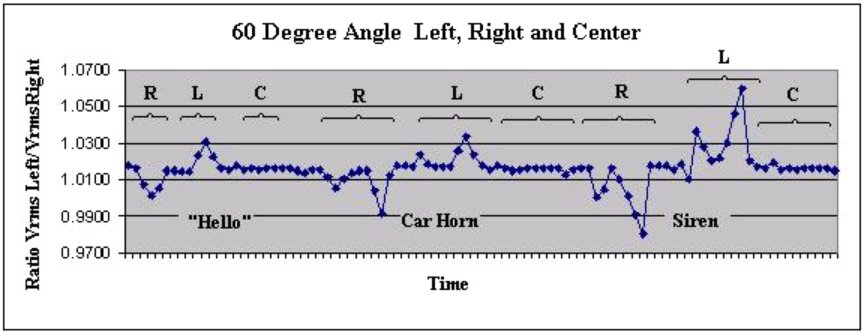
In the soundproof laboratory, the correlation method was unsuccessful in locating the sound source based on the phase difference between the microphones. There was a very small delay between the microphones but the sampling rate was not adequate to reliably detect these differences. Additionally, delays caused by the RC filter made the correlation less reliable since the delays were frequency sensitive. The second method, VRMS, was much more reliable. This method calculated the VRMS value of 100 samples from each microphone separately. Three successive measurements were taken and the average of the VRMS values for each microphone was used in calculating the ratio of the left/right VRMS value. The comparison was very consistent at a 60 degree angle relative to the sound source [Chart 1].
In the soundproof lab testing loud sounds (the siren, clapping and yelling) were represented accurately by the VRMS nearly 100% of the time. This was most apparent when the siren clip was played. When testing in the laboratory where ambient noise is greater and echoes are present, the VRMS method was not reliable for indicating the sound direction. When testing the device in this more realistic environment using sounds at angles of 60 degrees or greater, the direction of a yell or loud clap and whistle was indicated accurately only 60% of the time. Quieter noises, such as the sound clips played in the soundproof room, were only accurate in 50% of the trials. Accuracy of the system decreased at angles less than 60 degrees.
DISCUSSION:
Based on the data obtained in the laboratory, VRMS proved to be the most promising method for sound localization. There are variations in the data for sounds of small amplitude, but the device does perform better than a person who relies on guessing the direction from which the noise comes. Currently this prototype is able to function in environments with no echo and low ambient noise. Sounds, such as the user speaking or rubbing the microphones, will overwhelm the microphone circuits and cause the indicators to vibrate. A more reliable future design could use directional microphones to better pick up differences in the sound amplitude as well as to help filter out the user's voice.
Placement of the microphones and indicators was based on input from online forums with deaf and deaf/blind individuals. The completed DIVA will be built into a vest that can be worn under clothing and doesn't interfere with other hearing aid technologies. There will be two microphones, left and right, and three flat pager motors spaced across the chest that vibrate to indicate left, center and right [Figure 3]. The program will be made portable by using a DSP chip for the data acquisition and analysis and an A/D converter. A portable prototype will allow DIVA to be tested in a variety of environments.
-
Engleman F. Part 1: Seven reasons you hear between with two ears. Retrieved Aug 15, 2001. <http://www.hearingassociates.net/say_what/>. 1996.
-
2. Summers I. Tactile aids: an overview. Retrieved Aug 15, 2001. <http://newton.ex.ac.uk/medphys/pages/isasb.html>. 2001.
ACKNOWLEDGEMENTS
Funding was provided by NSF Grant BES-9981867 and the UNC Ueltchi Service Learning Grant
Faculty Advisor: Richard Goldberg
Covey A. Lathan
1601 Mt. Carmel Church Rd
Chapel Hill, NC 27514
Tel: (919) 933-4830
Email: covey@email.unc.edu