Wheelchair usage pattern: Does age matter?
ABSTRACT
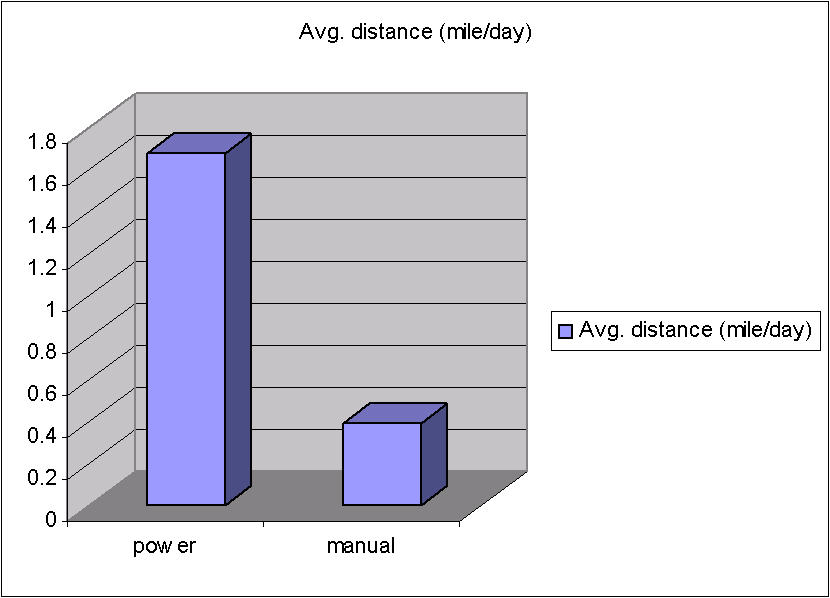
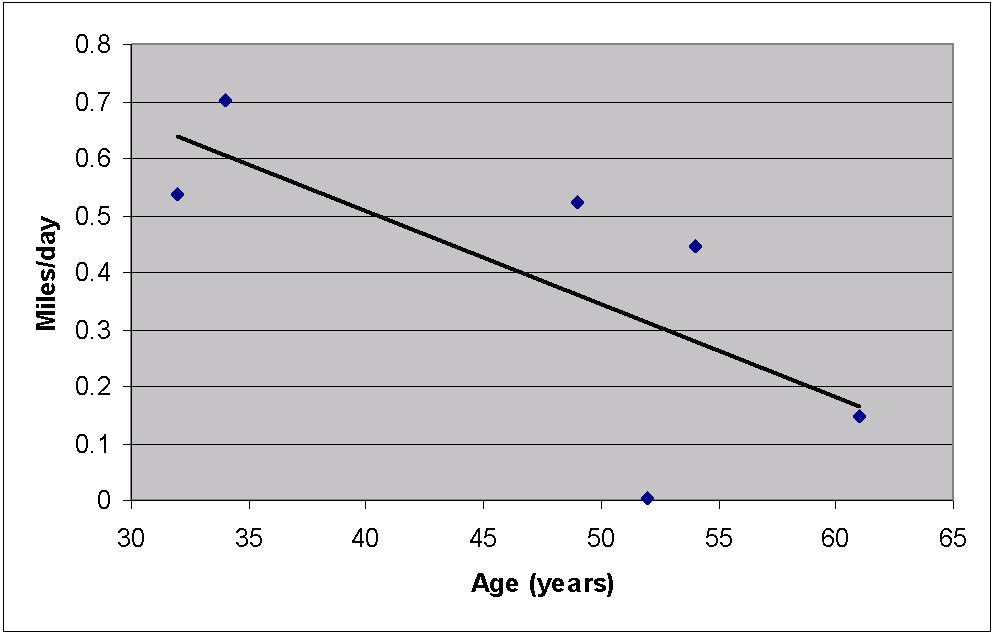
This study examines the average distance traveled of people in wheelchairs and relates it to the age and years of wheelchair use. Through the use of a data logger the average speeds and distances traveled by 29 power/manual wheelchair users living in a community setting were calculated for each day. Analysis of the data showed that there is no relationship between age of individuals and average distance traveled per day for the group overall. However, when separating the data into manual and power wheelchair user groups, it was found that the manual wheelchair group, with a mean average distance of 0.39 +/- 0.26 (mile/day), traveled less than the power wheelchair group whose members traveled at an average distance of 1.70 +/- 1.11 (mile/day). It was also found that, in the manual wheelchair group, age and years of wheelchair use have an influence on the average distance with the older subjects traveling less. Data analysis for the power wheelchair group showed no significant difference between age and years of wheelchair use in the average distance traveled by the group overall, from which one can conclude that the older individuals in power wheelchairs traveled further than their manual counter parts.
KEYWORDS
Manual wheelchair, power wheelchair, usage pattern, datalogger
BACKGROUND
When designing wheelchairs it is necessary to have an understanding of the usage patterns and activity levels of wheelchair users. Usage patterns may have important implications regarding the activity level of wheelchair users, which may be an indicator of secondary disability due to repetitive strain or insufficient activity. Understanding the activity level of wheelchair users could develop new directions for rehabilitation and community integration.
A study done by Cooper et.al. examined and compared power wheelchair users in the Pittsburgh, Pennsylvania area and at the National Veterans Wheelchair Games (NVWG) in San Antonio, Texas (2001) 1 . The study found that the users at the wheelchair games traveled farther and at greater speeds than the community based users. Activity levels, overall, were fairly high throughout the day except between the hours of one and five AM. As an extension of this study, Hoover et.al (2003) 2 compared driving habits of manual and power wheelchair users and found there was no significant difference between the speeds and distances traveled by the two types.
There is little known about the actual driving habits of both power and manual wheelchair users and how this may relate to age and years of wheelchair use.
RESEARCH QUESTIONS
- Does age and years of wheelchair use influence average distance traveled of people in wheelchairs?
- Is there a difference in wheelchair usage among manual and power wheelchair users?
- Is there a difference in average distance traveled for power and manual wheelchair users with similar diagnosis?
METHOD
A total of 29 wheelchair users were evaluated in this study, 6 manual users and 23 power users. Participants were recruited in the Pittsburgh, Pennsylvania area through the Human Engineering Research Laboratories database. The participants ranged in age from 24 to 64 with a mean age of 47.0 +/- 11.6 years for the manual wheelchair users and 44.3 +/- 10.5 years for the power wheelchair users. The average years in wheelchair use was 14.3 +/- 7.2 years for the manual user group and 15.4 +/- 9.0 years for the power user group. The manual wheelchair group included three subjects with tetraplegia and three with paraplegia. The diagnosis in the power wheelchair group included: tetraplegia 7; cerebral palsy 7; muscular dystrophy 3; spina bifida 1; multiple sclerosis 1; post polio syndrome 2; traumatic brain injury 1; and "other" 1. Data were collected with a TFX-11 datalogger attached to the participant's wheelchair 3 . All subjects in the manual group used ultra light (K005) wheelchairs and all subjects in power group operated either K0011 or K0014 power wheelchairs. A magnet was applied to the wheel of the chair and a switch to the frame. The switch closed as the magnet passed it and the date and time was recorded by the datalogger for duration of 5-7 days. All subjects were instructed to go about their daily activities as usual. The data were downloaded and a Matlab program was implemented to determine the average speed, and average distance traveled per hour over the length of testing time. Spearman's rho was done to determine correlations between average distance, age and yrs in wheelchair . Mann-Whitney tests were done on the average distance, the age and years in wheelchair use of each participant to determine if there was significant difference between the two types of wheelchairs (power and manual). Significant difference was displayed at a p -value of less than 0.05.
RESULTS
 |
|---|
Analysis of the data showed that there is no relationship between age of individuals and average distance traveled per day for the group overall. However, when separating the data into manual and power wheelchair user group there was a significant difference (p= 0.009) for the average distance traveled. It was found that the manual wheelchair group, with a mean average distance of 0.39 (mile/day), traveled less than the power wheelchair group whose members traveled at a mean average distance of 1.704 (mile/day). In the manual wheelchair group, a borderline significance was found for age and years of wheelchair use to influence the average distance traveled. In the manual group, the older subjects traveling less. Data analysis for the power wheelchair group showed no significant difference between age and years of wheelchair use in the average distance traveled by the group overall.
 |
|---|
Tetraplegia was found to be the only diagnosis, similar to both groups, with three subjects in the manual wheelchair group and seven subjects in the power group. The subject population revealed to be similar in age distribution and years of wheelchair use, and approached significant difference ( p = 061) in average distance traveled. Subjects with tetraplegia in their manual wheelchairs traveled a mean average distance of 2.67(mile/day) and the subjects with tetraplegia In the power wheelchair group traveled a mean average distance of 6.71( mile/day). People with tetraplegia seem to travel well above the mean average distance for the overall group mnaul and power wheelchair users.
DISCUSSION
This is the first study to evaluate distance traveled of wheelchairs that compares the type of wheelchair, age of the user, and diagnosis. We found that in the power wheelchair group, subjects traveled further and that age was not a limiting factor. It appears that age has an effect on the manual wheelchair usage patterns in that the data revealed, although borderline, that the older subjects traveled less. Age related symptoms such as pain, lack of endurance and decreased strength that interferes and limits mobility associated with functional self propulsion of any type of manual wheelchair, has less effect on mobility when using a power wheelchair. Clinicians involved with wheelchair prescription for the elderly population need to consider the effect their recommendation has on the overall mobility.
This study also revealed that subjects with tetraplegia traveled further when in power wheelchairs than their manual wheelchair counterparts. One possible reason for that is that power wheelchair users may be more apt to use their chairs to go longer distances before using a car.
REFERENCES
- Copper RA. et al. (2001) Driving Characteristics of Electric-Powered Wheelchair Users: How Far, Fast, and Often Do People Drive. Arch Phys Med Rehabil , 82, 1-6.
- Spaeth DM, Arva J, Copper RA. Application of A Commercial Datalogger For Rehabilitation Research. Proceedings RESNA 23 rd Proceedings, 2000, 313-315.
- Hoover, AE et.al. (2003) Comparing Driving Habits of Wheelchair Users: Manual vs. Power, Proceedings RESNA 26 th Proceeding 2003,
ACKNOWLEDGEMENTS
This study was partially supported by the Veterans Affairs Center of Excellence on Wheelchairs and Related Technology (Award number F2181C)
Author Contact Information:
Rosemarie Cooper, MPT,ATP,
7180 Highland Drive,
Building 4, 2 nd Floor,
East
Wing 151R-1,
Pittsburgh, PA 15218,
Office Phone (412) 365-4850,
EMAIL: cooperrm@pitt.edu