Mobile Wireless Activity Monitoring to Prevent Pressure Sores in Wheelchair Users
ABSTRACT
A mobile wireless activity monitoring system designed to track weight-shifts performed by wheelchair users has been developed. The system is intended to help prevent development of pressure sores and is designed to perform continuous activity measurements. The system uses wireless data communications to provide feedback to both the wheelchair user and skin care specialists.
KEYWORDS:
activity monitoring, pressure ulcers
BACKGROUND
Pressure ulcers are a major public health problem in the US and can lead to painful, life-threatening, and expensive medical complications. Approximately one-third of persons with spinal chord injuries (SCI) have pressure ulcers (1). For wheelchair users, pressure ulcers may be a direct result of not performing regular weight-shift exercises. As over 1.5 million people in the US use wheelchairs (2), many with SCI, this represents a major health problem. Georgia Tech and the Shepherd Center have developed a mobile wireless Mobile Activity Monitoring (MAM) system that can be used by consumers at home or while they move about the community. This is different from the accurate but expensive pressure mapping that is done at wheelchair seating clinics as well as from the low cost, on-or-off monitoring of some current products sold for home use. The MAM system performs continuous activity monitoring and can provide valuable feedback to both the consumer and the caregiver through a web-based interface. In the mobile system, weight-shift activity is measured by small, flat, low-cost sensors placed under the cushion in the seat of the wheelchair. A Blackberry two-way pager processes the data from the sensors in the chair and transfers the electronic records to a central database. The database is securely accessible over the Internet and allows access to weight-shift activity data by clients and authorized caregivers. The goal is to encourage the consumer to perform regular weight-shifts and allow caregivers to intervene when high-risk periods of inactivity are detected.
Several approaches were considered for monitoring weight-shifts. One idea was to use existing seat pressure mapping tools such as the FSA Seat and Back System (Vista Medical Ltd.) or TekScan, Inc.'s ClinSeat® products. These provide accurate pressure maps that are used in seating clinics, but they are not designed for continuous mobile monitoring outside of the clinic due to cost, durability, recalibration requirements, long-term effects of the sensor array on users' skin, etc. Related research by Bain et al utilized an FSA pressure mapping system for the purpose of monitoring seating behavior of wheelchair users, but that system did not employ wireless data transmission and those researchers raised concerns over the long-term use of the sensor array (3). Another approach, sold as a product by Cleveland Medical (4), emphasizes weight-shift reminders for wheelchair users via beeps or vibrations, but it does not use wireless networking to monitor or display results. In addition, there are calibration thresholds that must be set to accommodate for variability in individual weight, seating conditions, and sensor drift. In contrast, the MAM system uses a simple, low-cost sensor array that self calibrates and employs wireless networking to send the data to a central database.
METHODS
 |
|---|
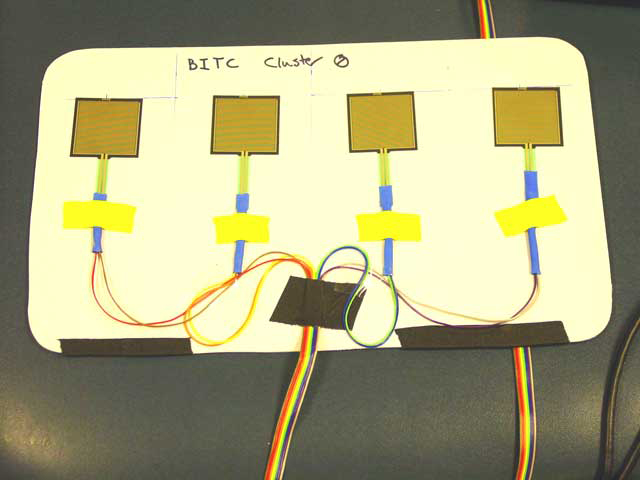
The MAM system is comprised of an array of force sensing resistors (FSRs), an electronics box for analog to digital conversion of seat pressure signals, and a Blackberry pager for wireless data processing and transmission. The FSRs, manufactured by Interlink, are not designed to provide a precise measure of force and variations between sensors may be as much as +/- 10 to 20 %. A variety of external factors also contribute to variability in the FSR measurements including bending and temperature. The FSRs were selected for the MAM because they offer a low cost (less than $5) and small form factor that can lie flat in the seat of a wheelchair under the cushion. The variability in measurement is not a concern because precise pressures are not needed to measure short-term (seconds) changes in seat pressures. In the current prototype, four FSRs are mounted in a line on a semi-rigid rectangular plastic base that is encased between two layers of rubber sheeting for protection from moisture, abrasion and sharp impacts (Photo 1). The sensor pad configuration described above is best suited for air cushions such as a Roho II. Cushions with a rigid base such as the Jay2 require a different sensor configuration that sits between the rigid basin and the gel cushion. The system is designed to accommodate variability in where the sensor pad is placed, but it should generally be positioned in the center of the chair below the ischial tuburosities.
 |
|---|
A low-cost, battery-powered data acquisition board, manufactured by DATAQ, collects sensor data using an 8-bit analog to digital (A/D) converter with a serial interface. Signal conditioning electronics are implemented on a custom circuit board using op-amp circuitry to make sensor values more linear in response to pressure. The Blackberry collects output from the DATAQ A/D at approximately four Hertz. A long-term moving average (LTMA) is maintained for the left and right sides of the sensor array to track the average seating forces of the user independent of variable conditions such as sensor drift, temperature, posture, etc. The LTMA is used to estimate the pressure state during which the individual is sitting normally without performing a shift. Shift percentage is measured as the percentage of deviation from this average. The MAM system tries to detect weight-shift events so that sensor values during these events can be excluded from the LTMA. If a user performs a weight-shift, the algorithm detects a significant change in pressure and omits sensor data updates to the LTMA temporarily. After the end of the shift, the algorithm begins to allow LTMA updates again. By using this LTMA estimate, the system accommodates for sensor drift and slowly changing seating posture.
 |
|---|
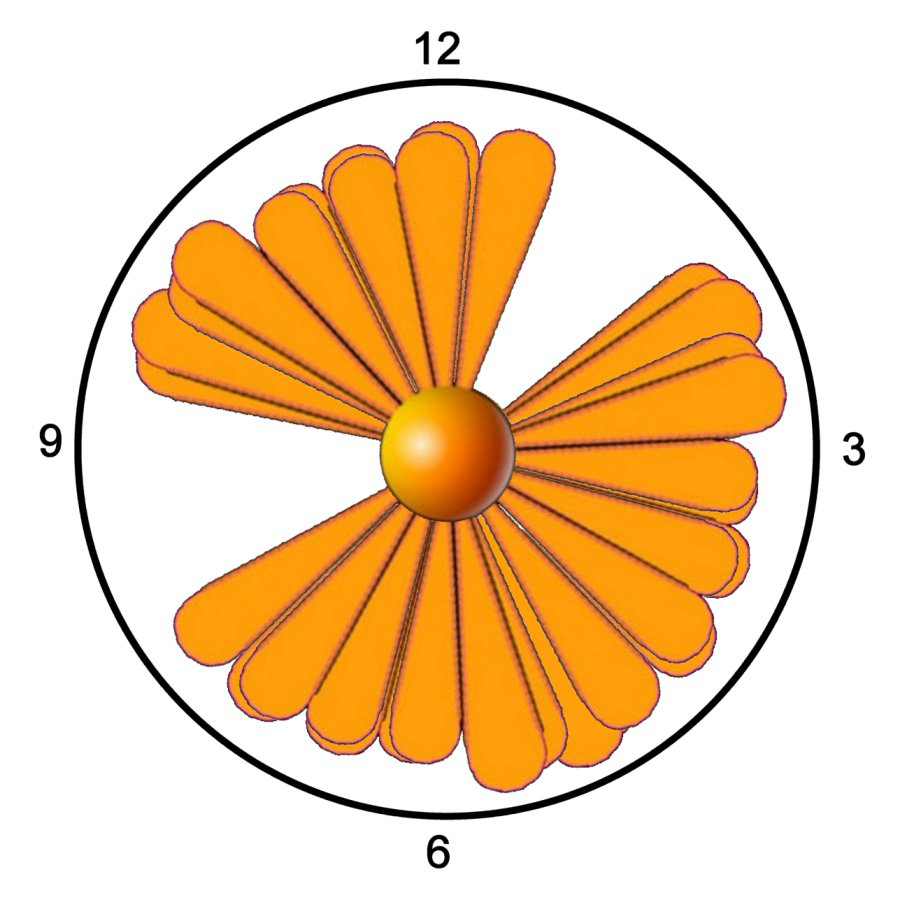
Changes between the left and right sensor values, normalized by the LTMA, are reported as a shift percentage. A shift percentage of 0% describes a condition where the user is sitting stationary, and a shift percentage of 100% describes the condition where all of the weight has shifted off of at least one side of the seat. The algorithm is executed on the Blackberry pager. The pager then packages the data into emails that are sent to a central server. The server parses the email and inserts the data into a database that can be accessed by authorized users over the Internet. A data receipt mechanism is implemented to insure successful data delivery. Web tools have been developed to present weight-shift activity data in several different formats. Polar plots (Graph 1), intended to be available for both the wheelchair user and caregivers, present a quick overview of seating activity over the course of a day. At risk periods of extended inactivity and the times at which these occur can be easily identified. Graph 2 shows an example of the Daisy Plot format for presenting simplified activity information to the wheelchair user. In the daisy plot, the petals and petal length represent activity, missing petals represent inactivity, and time corresponds to a 12 hr or 24 hour clock. A healthy Daisy Plot would show full petals throughout the day. When petals are short or missing, the user can tell at a glance when periods of low activity are occurring. Additional web tools allow the caregiver to take a more detailed look at the data in the form of spreadsheet-formatted data. This allows the caregiver to examine more subtle changes in activity.
RESULTS
 |
|---|
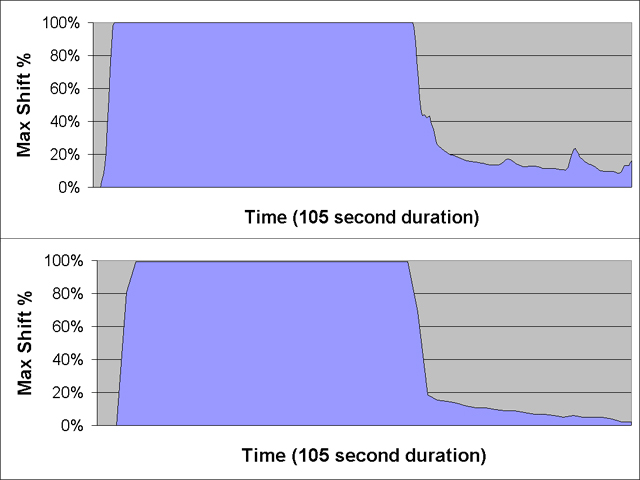
Development efforts have resulted in the successful completion of a functioning MAM device that remotely collects seat pressure data. To test whether the MAM sensors were correctly monitoring weight-shifts, activity measurements were performed simultaneously with the MAM and a calibrated FSA mapper. The same algorithm for computing shift percentage was used with both systems. The 16x16 sensor array of the FSA system was divided into four 4x16 strips to allow a matching between the four sensors in the MAM system. This technique allowed direct comparisons between activities measured by the FSA sensors and the MAM system. Comparison of shift percentage measurements from the FSA with the MAM system showed strong similarity for a variety of scripted activities including: left shift, right shift, full shift, forward shift and an arm movement exercise. Except for the forward shift, the MAM system values were within 10% of the weight-shift percentage values derived from the FSA system. A likely source of the difference between the two is the four sensors of the MAM system only sample a small portion of the user's seat pressure while the FSA system samples most all seat forces. This difference is especially true for the forward shift where the FSA measures forces on the thighs that the MAM system cannot pick up. Shift percentage comparisons for a full shift event are shown in Graph 3.
DISCUSSION
There are several remaining research questions related to this study: 1) Can high-risk periods of inactivity be detected before skin problems occur? 2) Does providing information about patterns of activity guide the consumer to better self management, and 3) Are there unconventional patterns of activity without performing formal weight-shift exercises that can sustain adequate blood flow and prevent skin problems? In this paper, the methods for building the MAM system are described, and a simple test showed that it agrees with a standard pressure mapping system used in seating clinics. The remaining research questions can now be addressed.
REFERENCES
- Fuhrer MJ, Garber SL, Rintala DH, Clearman R, Hart KA. Pressure ulcers in community-resident persons with spinal cord injury: prevalence and risk factors. Arch Phys Med Rehabil . 1993;74:1172-77.
- Kaye H, Kang T, LaPlante M, Wheelchair Use in the United States . Disability Statistics Center . 2002; Abstract 23.
- Bain D, Ferguson-Pell M. Remote monitoring of sitting behavior of people with spinal cord injury. J Rehabil Res Dev . 2002;39-4:513-520.
- Schmidt R, Float J, Hendrix S, inventors; Cleveland Med. Devices Inc., assignee. Pressure relief reminder and compliance system. US patent 6,030,351. 2000.
Author Contact Information:
Jeff Wilson, MS,
GA Tech, 250
14 TH ST NW ,
Atlanta , GA ,
Phone: (404) 894 7021
EMAIL: jeff.wilson@bitc.gatech.edu