Wheelchair Seatback Loads and Deflections in Rear Impacts
ABSTRACT
A series of dynamic impact sled tests was conducted using a surrogate wheelchair base (SWCB) fitted with an instrumented seatback (ISB) to quantify the expected forces imposed on wheelchair seatbacks by a midsize adult male anthropomorphic test device (ATD or crash dummy) during moderate-to severe rear-impact collisions. Tests were conducted for three different seatback stiffness levels that resulted in post-test seatback deflections of approximately 15, 40, and 60 degrees. Tests were also conducted with the ISB replaced by a commercial fabric seatback to validate that the performance of the ISB provides seatback deflections that are representative of lighter and more compliant production wheelchair seating. Peak forces perpendicular to the surface of the seatback ranged from about 4500 to 7000 N (1000 to 1500 lb) and showed only a small increase with significant increases in seatback stiffness that resulted in significant reductions in seatback deflections. For each seatback stiffness, seatback deflections were similar for the ISB and fabric seatbacks. These data should be useful for wheelchair manufacturers seeking to design wheelchairs with improved rear-impact performance.
KEYWORDS
Wheelchairs, transportation, crash safety, rear impacts, seatback strength
BACKGROUND
ANSI/RESNA WC/19 Wheelchairs for Use as Seats in Motor Vehicles (WC/19)
is a voluntary wheelchair standard that addresses the use of wheelchairs as
seats in motor vehicles (1). It sets forth procedures and performance criteria
to evaluate the frontal crash performance of occupied, forward-facing wheelchairs
using a 48-kph (30-mph),
20- g crash pulse. While performance of the vehicle seat is critical
to effective occupant protection in frontal crashes, which account for more
than half of all serious and fatal injuries to motor vehicle occupants (2),
the performance of the vehicle seat, particularly the vehicle seatback, is
even more important to occupant protection in rear impacts because it is the
primary restraining surface for the forward-facing occupant in a rear-impact
crash.
A previous series of rear-impact sled tests conducted at the University of Michigan Transportation Research Institute (UMTRI) demonstrated that many WC/19-compliant wheelchairs would not provide effective back support for wheelchair occupants in moderate-to-severe, rear-impact collisions. The current study was conducted to address this concern and to provide quantitative information for wheelchair manufacturers to improve wheelchair design and seatback strength during rear-impact loading. Specifically, the purpose of the study was to determine the seatback forces in rear-impact crashes as a function of seatback stiffness. A secondary objective was to evaluate the performance of the ISB and increase confidence that the measured forces are representative of forces applied to seatbacks of production wheelchairs under similar loading conditions.
METHODS
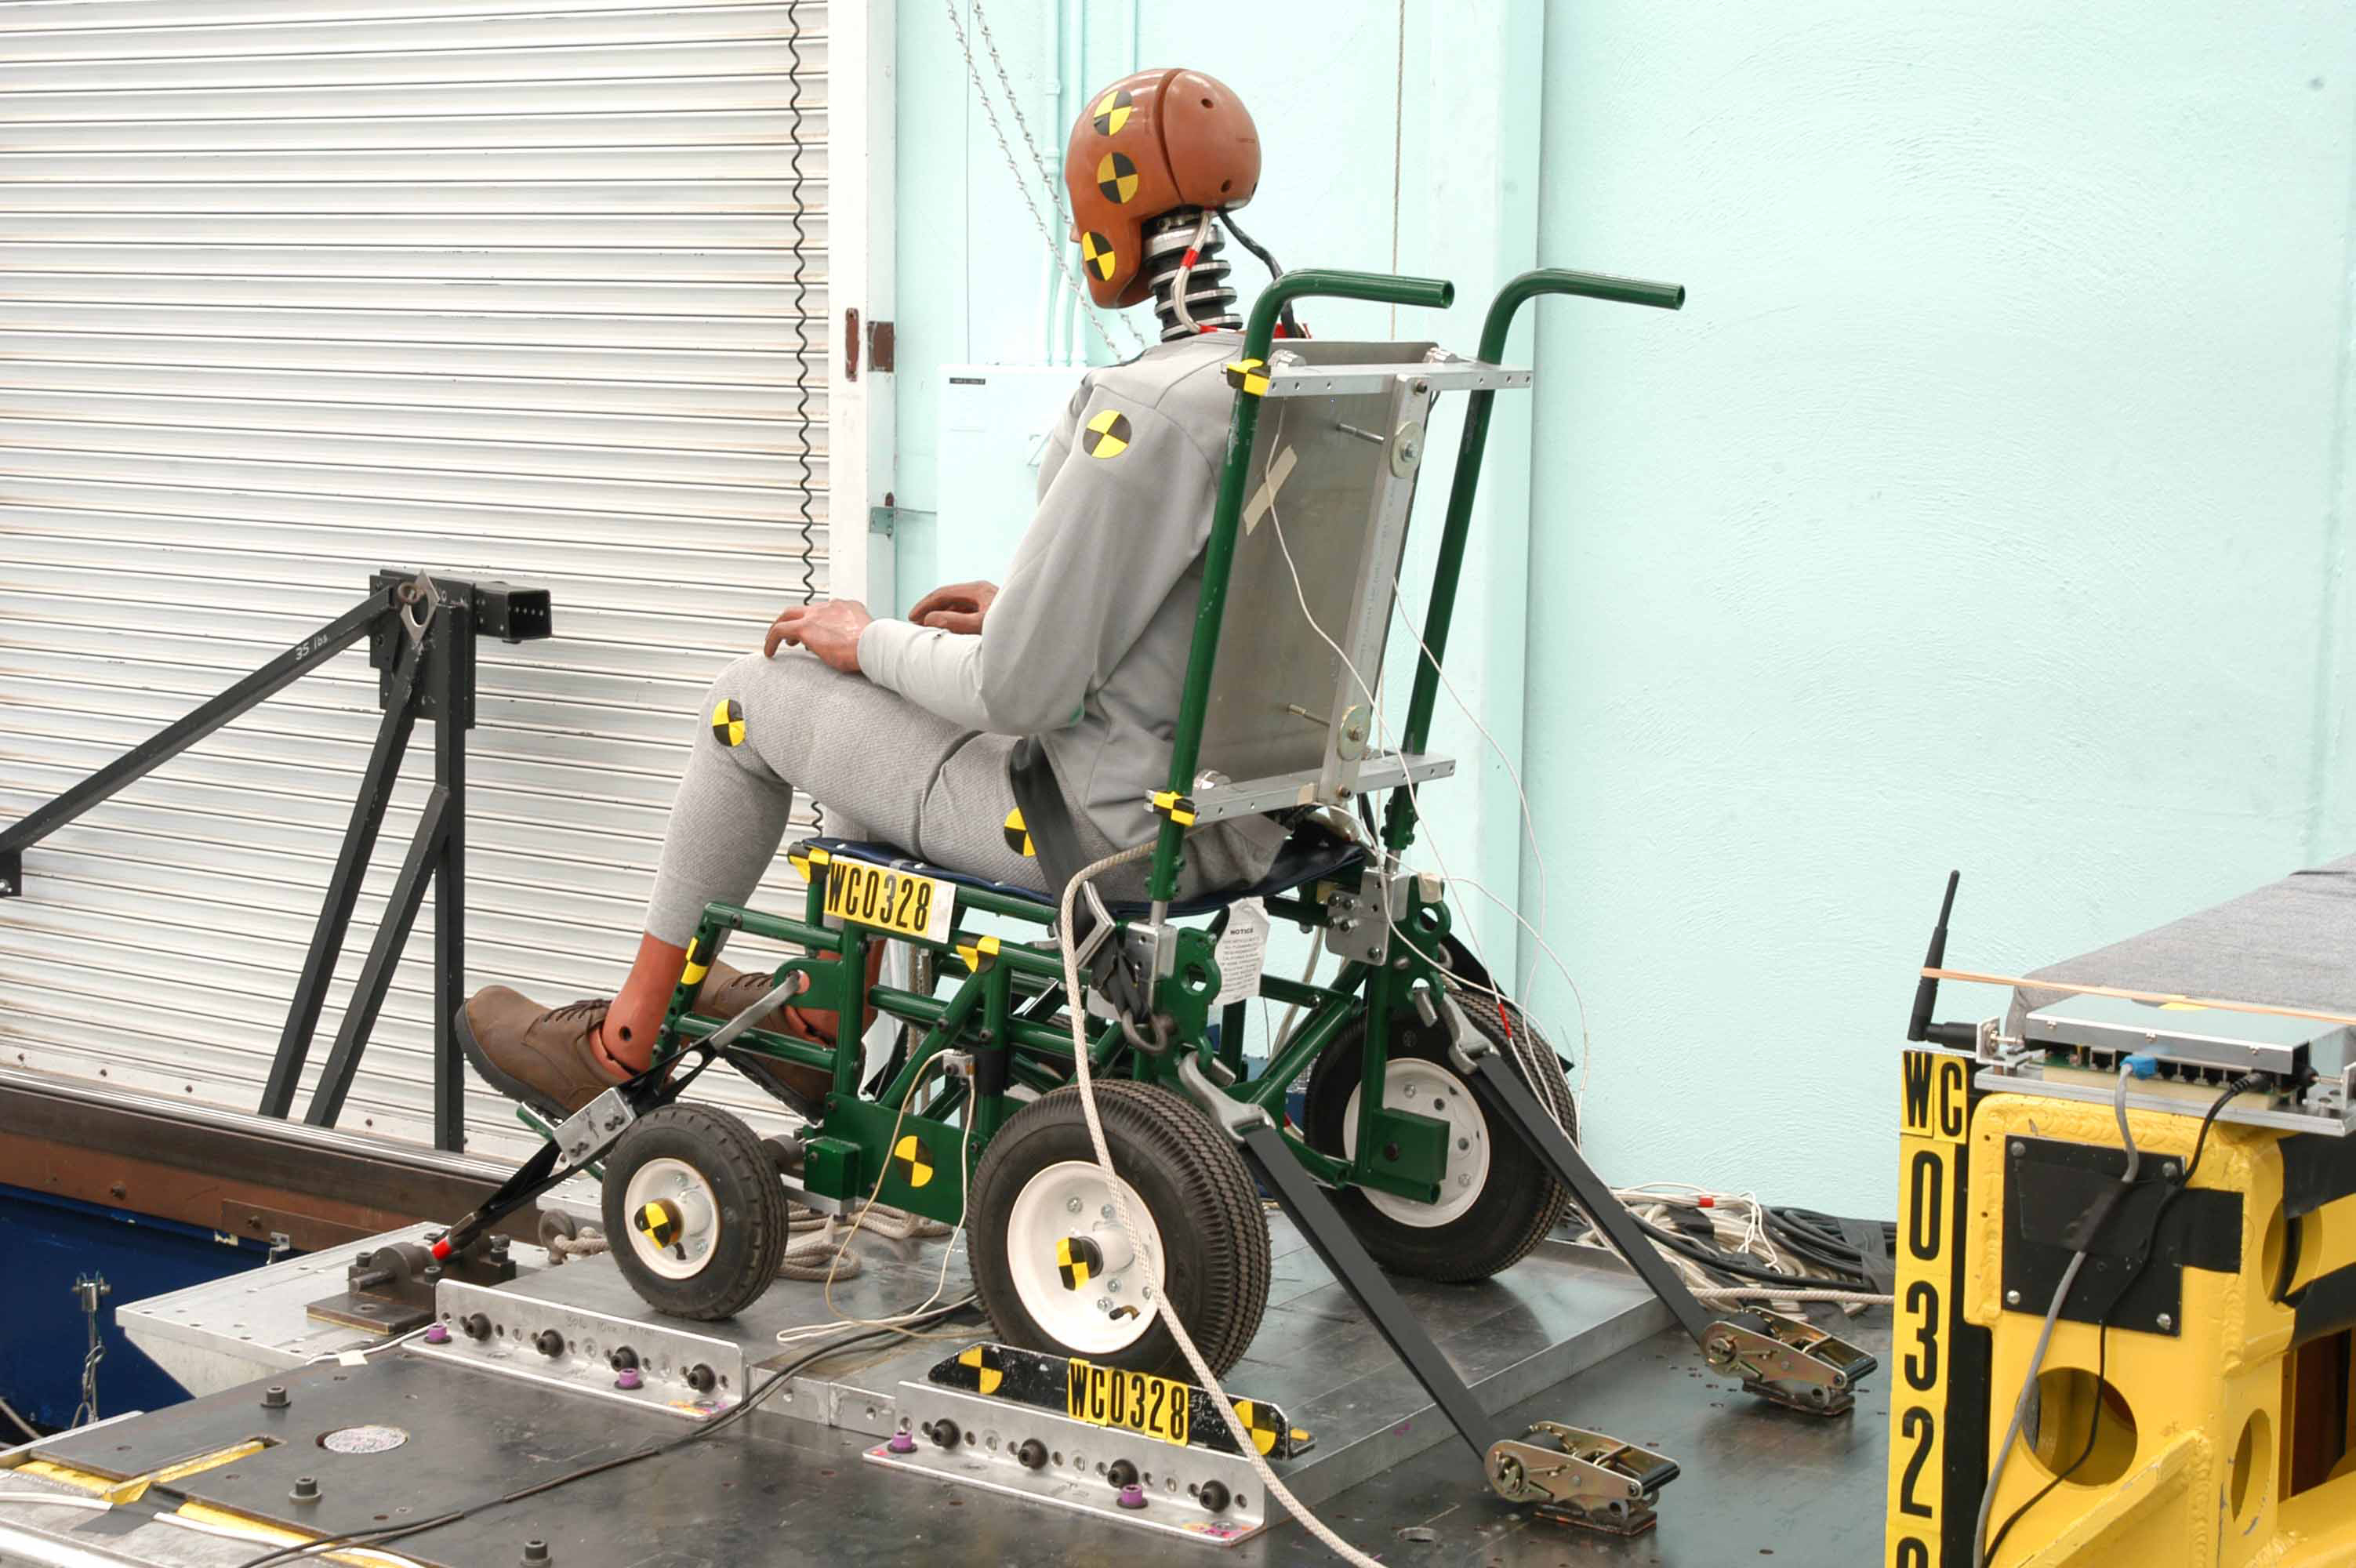
Thirteen rear-impact sled tests were conducted using a 25-kph (16-mph), 10- g crash pulse and a 107-lb SWCB. The SWCB includes seatback posts that attach at the back of the seat rails by means of replaceable rods that can be varied in material properties to modify the stiffness of the seatback. To determine the forces applied to the seatback during loading by an ATD, an ISB was fabricated using four single-axis load cells placed between an aluminum planar seatback and horizontal mounting bars and was attached to the SWCB seatback posts. Each load cell was interfaced to the aluminum plate with a spherical interface to minimize off-axis loading, so that the ISB measures only the force applied perpendicular to the plane of the seatback.
Seatback Stiffness Level |
Seatback Type |
Number (N) |
|---|---|---|
Low |
ISB |
2 |
Low |
Fabric |
1 |
Med |
ISB |
4 |
Med |
Fabric |
2 |
High |
ISB |
3 |
High |
Fabric |
1 |
| ISB = instrumented seatback | ||
Table 1 shows the matrix of test conditions and the number of tests conducted at each condition. A Hybrid III ATD with mass (77.3. kg or 170 lb) and anthropometry (stature of 156 cm or 5 ft, 9 in) representative of an average U.S. adult male was placed in the SWCB for all tests and restrained by a wheelchair-anchored pelvic belt. As indicated in the first column of Table 1, tests were conducted using three levels of seatback stiffness referred to as Low, Medium, and High, by connecting the seatback posts to the SWCB using different connecting rods. In addition to testing with the ISB, tests were also conducted with a commercial fabric seatback to determine if the heavier ISB provides representative seatback deflections for the loading conditions of these tests.
 |
|---|
A fabric seatpan was used in all tests to provide realistic downward compliance of the seat. Deformable aluminum bars to which the front SWCB wheels are mounted provide downward compliance at the front of the SWCB and were replaced after each test. As shown in Figure 1, the SWCB was secured facing rearward on the UMTRI sled using the surrogate four-point strap tiedown system specified in Annex D of ANSI/RESNA WC/19. With the exception of varying the seatback stiffness and seatback type, all conditions were reproduced as closely as possible for all tests.
 |
|---|
RESULTS
In all thirteen tests, the SWCB was effectively secured to the sled platform with peak wheelchair excursions measured at the a seating reference point ranging between 22 and 29 mm, and an overall average excursion of 28 mm. The ATD was effectively restrained in the seat and the pelvic belt prevented the ATD from ramping up or over the seatback in all tests.
Seatback |
SB |
Post-test |
Peak Normal SB Load |
|
|---|---|---|---|---|
Stiffness |
Type |
SBA degrees |
||
|
|
wrt vertical |
N |
(lb) |
Low |
ISB |
64 |
5050 |
1135 |
Low |
ISB |
61 |
5073 |
1141 |
Low |
Sling |
55 |
-- |
-- |
Med |
ISB |
40 |
4674 |
1051 |
Med |
ISB |
41 |
4449 |
1000 |
Med |
ISB |
40 |
5850 |
1315 |
Med |
ISB |
38 |
5690 |
1279 |
Med |
Sling |
44 |
-- |
-- |
Med |
Sling |
40 |
-- |
-- |
High |
ISB |
16 |
5430 |
1220 |
High |
ISB |
14 |
7014 |
1577 |
High |
ISB |
17 |
6600 |
1484 |
High |
Sling |
16 |
-- |
-- |
| SB = seatback; SBA = Seatback angle | ||||
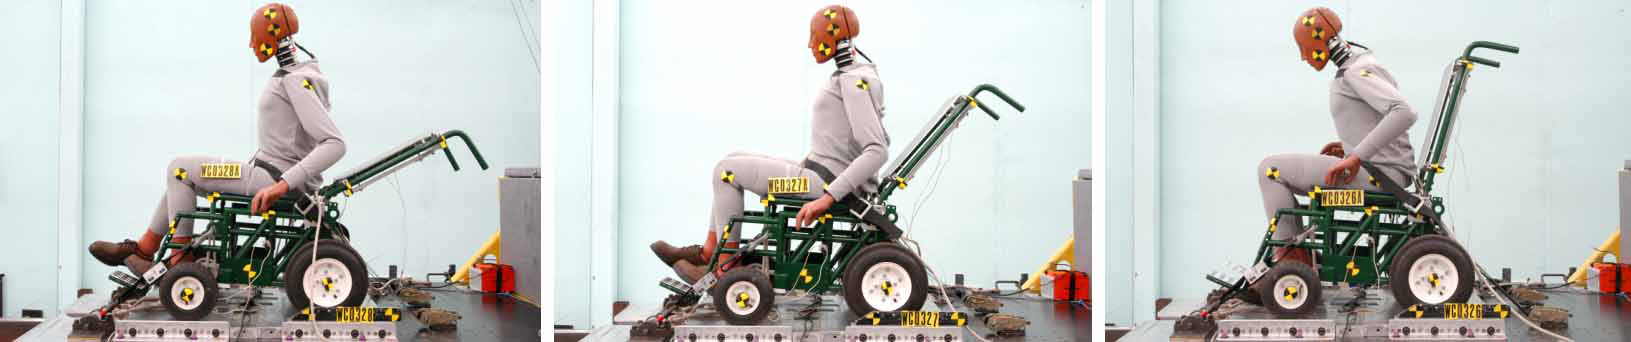
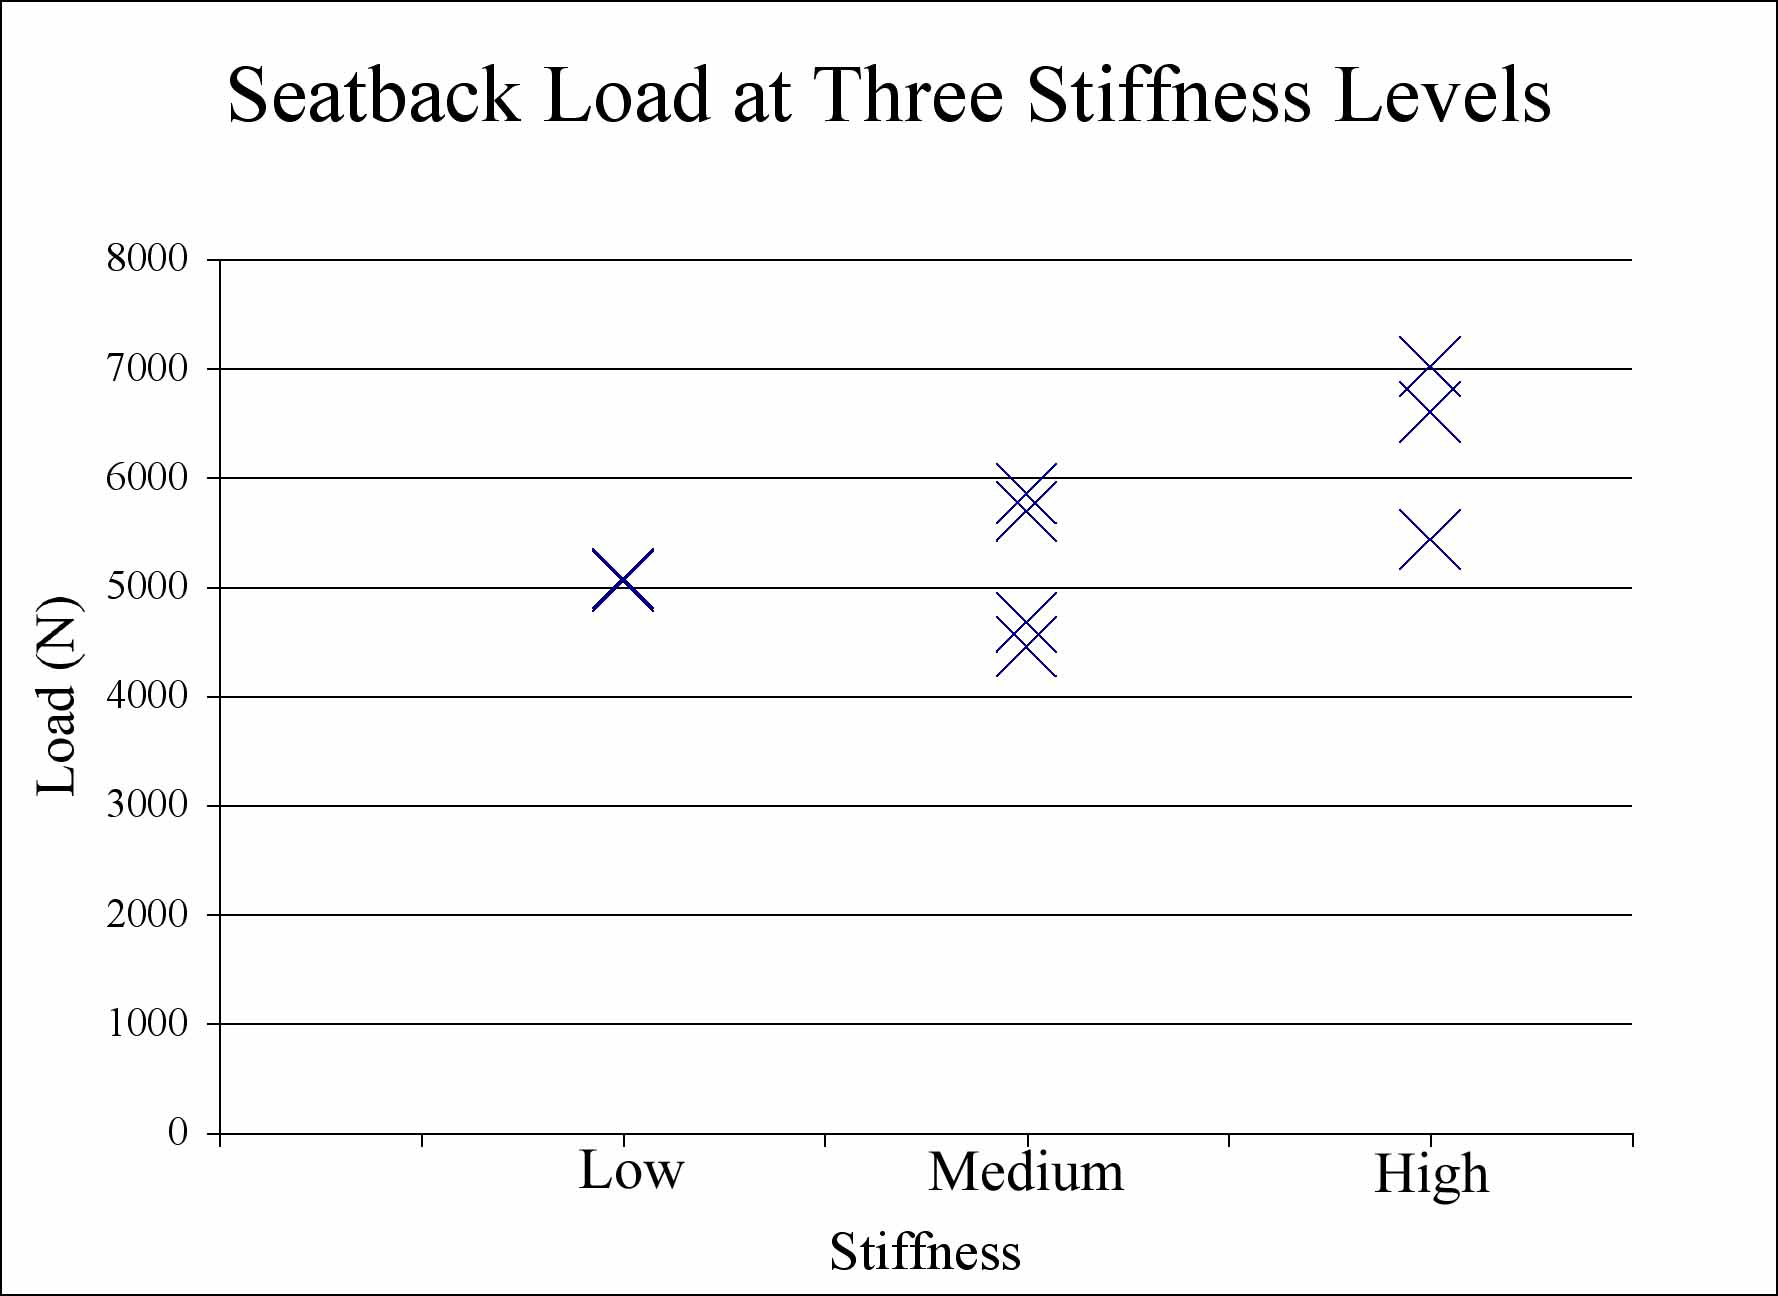
Table 2 lists the principal test results relative to the study objectives, including the post-test angle of the seatback posts with respect to the vertical, and the peak resultant force applied to the seatback for tests using the ISB. The post-test angles of the seatback posts vary from about 15 degrees for the high seatback stiffness, to about 40 degrees and 60 degrees for the medium and low stiffness levels, respectively. These post-test seatback angles are illustrated in the post-test side-view photos of Figure 2 for three tests with the ISB. The ISB and fabric seatbacks had similar post-test seatback angle deflections, with slightly less deflection observed with the fabric seatback at the lowest seatback stiffness. The ATD kinematics were very similar for the high and medium seatback stiffnesses for runs with the ISB and fabric seatback. At the lowest seatback stiffness, the ATD motions were still similar with the two seatback types, however, more chaotic dummy motions and more upward ramping was observed with the fabric seatback condition with the largest seatback deflections. The peak resultant normal loads on the ISB range from 4449 to 7014 N (1000 to 1500 lb) but show only a weak trend of higher force with higher seatback stiffness, as shown in Figure 3. The peak load was applied toward the bottom of the seatback surface early in the impact sequence.
SUMMARY AND DISCUSSION
 |
|---|
Providing effective occupant protection in moderate-to-severe rear impacts is largely dependent the strength and geometry of the vehicle seatback, which serves as the primary restraint for a forward-facing motor vehicle occupant during an impact to the rear of the vehicle. The results of this study show that, for a 25-kph,10- g rear-impact, peak loads perpendicular to the wheelchair seatback range from 4449 to 7014 N (1000 to 1500 lb) and do not change significantly with variations in seatback stiffness. The results also show that stiffening the seatback reduces rearward seatback deflection during rear-impact loading but does not significantly increase the normal force on the seatback. While these data were necessarily obtained from the relatively rigid and heavier instrumented seatback, the comparison of seatback deflections and ATD kinematics for the ISB tests with test results using a fabric seatback suggest that these forces are similar to the forces that would be exerted on seatback of production wheelchairs.
REFERENCES
- ANSI/RESNA, ANSI/RESNA WC/19:Wheelchair Used as Seat in Motor Vehicles. May 2000.
- National Highway Traffic Safety Administration, Traffic Safety Facts 2001, US Department of Transportation, Washington, D.C., 2001.
ACKNOWLEDGMENTS
This study was funded by the National Institute for Disability and Rehabilitation Research through the Rehabilitation Engineering Research Center on Wheelchair Transportation Safety, Grant # H133E010302.
Author Contact Information:
Miriam A. Manary,
Biosciences Division,
University of Michigan Transportation
Research Institute,
2901 Baxter Road, Ann Arbor, MI, 48109-2150