Sonification Sandbox: A Graphical Toolkit for Auditory Graphs
ABSTRACT
The Sonification Sandbox is a Java application for creating auditory graphs and sonifications so both sighted and blind students and scientists can participate more fully in situations where the use of visual graphs has typically been an impediment. Other uses include data exploration, and experimenting with sonification techniques and parameters. Users can independently map several data sets to timbre, pitch, volume, and pan, with full control over each sound attribute. They can also add context (akin to axes and tick marks) to the graph using a click track or a constant, repeating, or notifying tone at the minimum, maximum, or mean of a given set of data. A visual graph is also created to support simultaneous visual inspection of the data. The auditory graph may be saved as a standard MIDI file.
KEYWORDS
Sonification, auditory graph, sound, blind, visually impaired
INTRODUCTION
Sonification is the use of non-speech audio to convey information such as that used in the interpretation of scientific results. That is, scientific data, of any sort, are used to change the parameters of a synthesized tone in order to create an auditory graph. Walker has pointed out the benefits of auditory graphs in science and education, for both visually impaired and sighted users [1]. However, despite the potential scientific and educational benefits, there are very few widely available software tools for creating sonifications and auditory graphs. The few sonification toolkits that have been developed are either proprietary, dependent on a specific hardware or software platform (e.g., SGI/Irix), are not powerful enough, or are built for the expert sonification designer, and not the school teacher, student, or average researcher. There is a clear need for an effective, robust, highly usable, cross-platform, and widely available sonification and auditory graphing toolkit. Such a system would be useful both for assisting blind individuals in understanding data and exploring auditory graph possibilities.
RELATED WORK
The Sonification Sandbox follows on the work of Lodha and his students at the University of California, Santa Cruz [2,3]. MUSART [3] is similar to the Sonification Sandbox in its ability to change register, pitch, duration, loudness, thickness, timbre, balance, and beats. MUSART differs in its focus on the addition of musical elements to the sonification; the Sonification Sandbox focuses more on the addition of context, which Smith and Walker have shown to be valuable in auditory graphs [4]. Also, MUSART remains a platform-dependent application, and would require porting the code to several new platforms before widespread deployment would be possible [3]. Other similar work includes Upson's Sound Grid that, like the Sonification Sandbox, uses Java to create a multi-platform graphical application [5]. Sound Grid enables users to plot points of varying magnitude (mapped to note duration) on a Cartesian grid, and then play the sonification. Sound Grid is a useful exploratory tool but is primarily designed for young users, with a limited utility for the kind of precise parameterization useful for clearly expressing data with sound. As with MUSART, Sound Grid does little to provide auditory context.
Overall, our analysis of available sonification systems has yielded many of the same conclusions expressed by Wilson: most have produced encouraging results in support of the potential usefulness of sonification, but as applications, they fail to address many issues critical to its widespread adoption as a research technique [2]. These shortcomings include the need for exotic hardware, support for very few platforms, domain-specific design, and limited numbers of data sets and/or parameters.
DESIGN
The Sonification Sandbox is, as the name suggests, intended to provide the user with a simple, user-friendly, moldable, responsive environment for creating sonifications. As with the sandboxes on a playground, one size fits allthe Java implementation allows users on all popular platforms to use the software with little or no setup, and open-source code enables developers to shape the application to meet their individual needs and preferences. Once a sonification is satisfactory, it's easy to show and tellthe application supports MIDI export for easy sharing of auditory graphs across multiple platforms.
The software (at this time, version 2.1) can be downloaded (with source code) at http://sonify.psych.gatech.edu/research/. It is in a runnable JAR file, and is executable on MIDI-enabled Windows, Macintosh (OS X), Linux, and Solaris SPARC platforms with Java 2, version 1.3.1 or higher.
Features in Version 2.1
The Data Tab allows the user to import data from a comma separated value (CSV) file, exported from an application like Microsoft Excel. A valid input file must consist of all-numerical input in the form of an MxN matrix. Users can update data while the Sonification Sandbox is open by saving the data in an external editor and re-importing it into the application.
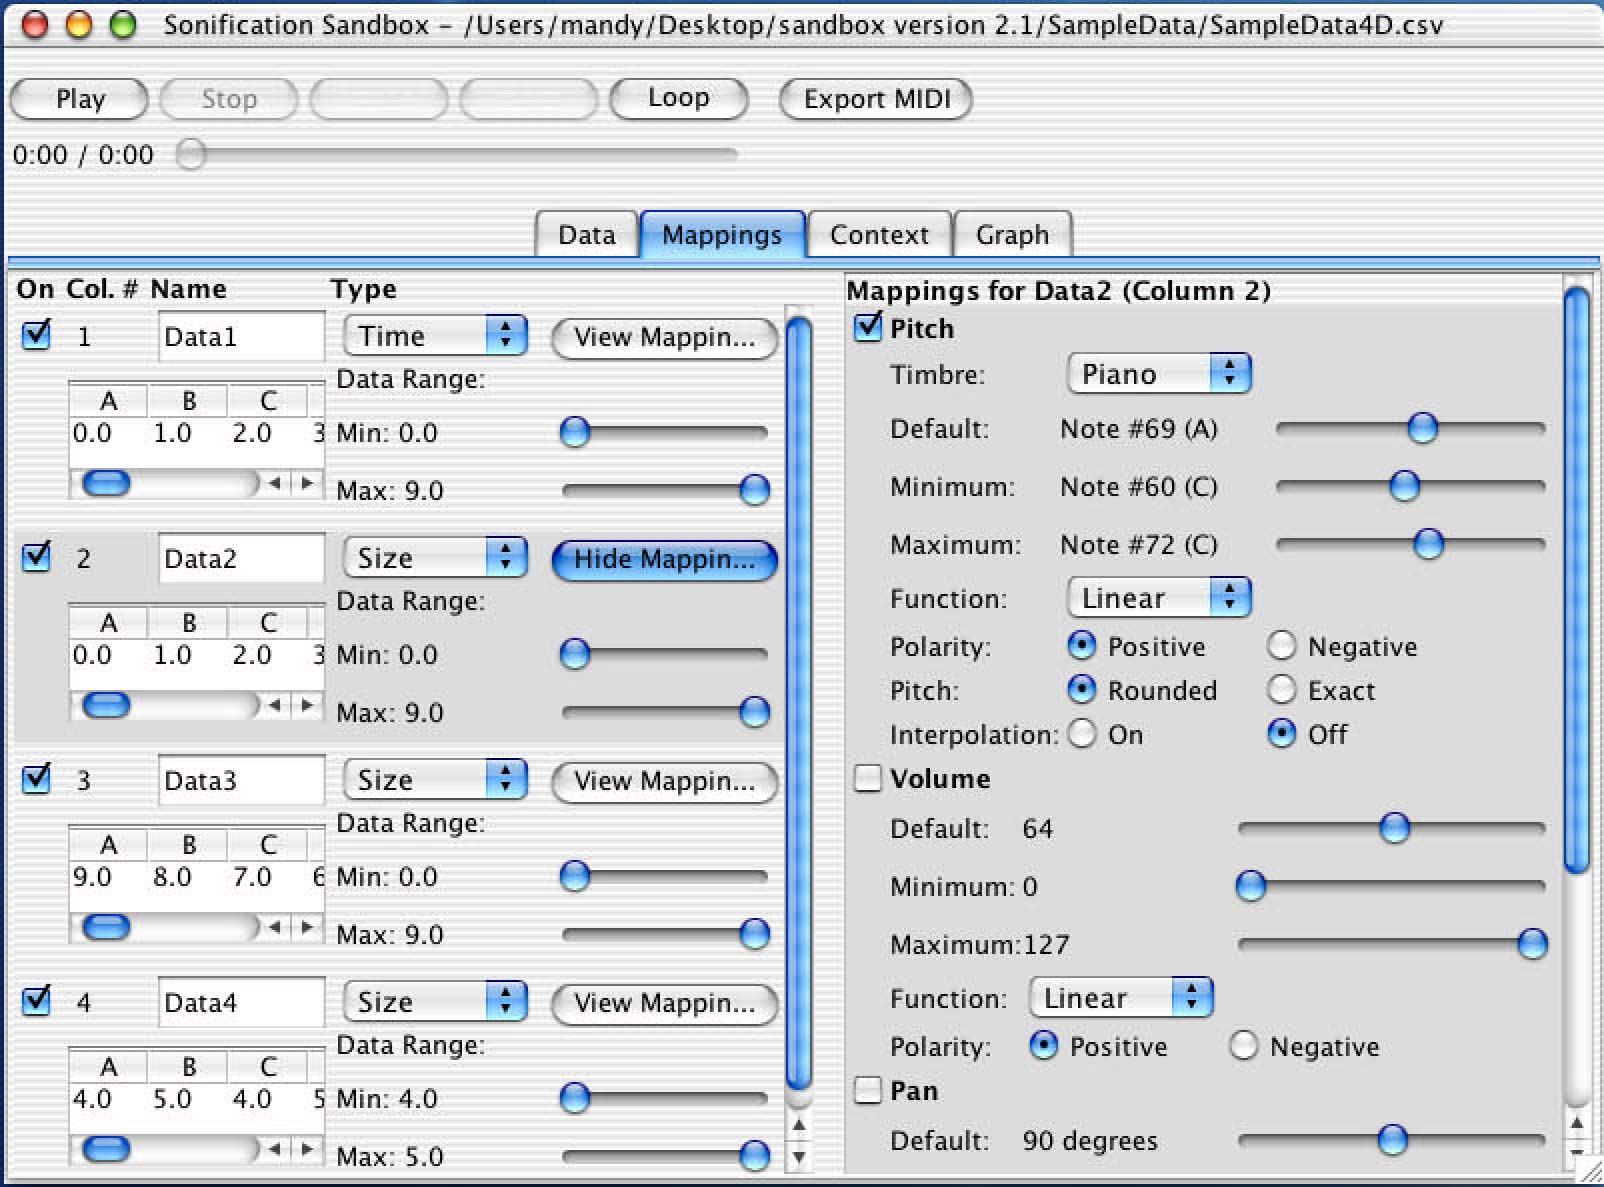 |
In the Mappings Tab each data set can be mapped to pitch, timbre, volume, and pan independently. The manipulation of these variables aids in expressing the meaning of the data and therefore help the visually impaired obtain a clearer conception of the data. For example, stock market data might be mapped to pitch such that increasing stock price is represented by increasing pitch. Also, the polarity of a mapping can be reversed to match the user's conceptual model of magnitude for a combination of data type and tonal attribute. Thus, increasing temperature could be mapped to decreasing pitch, if desired.
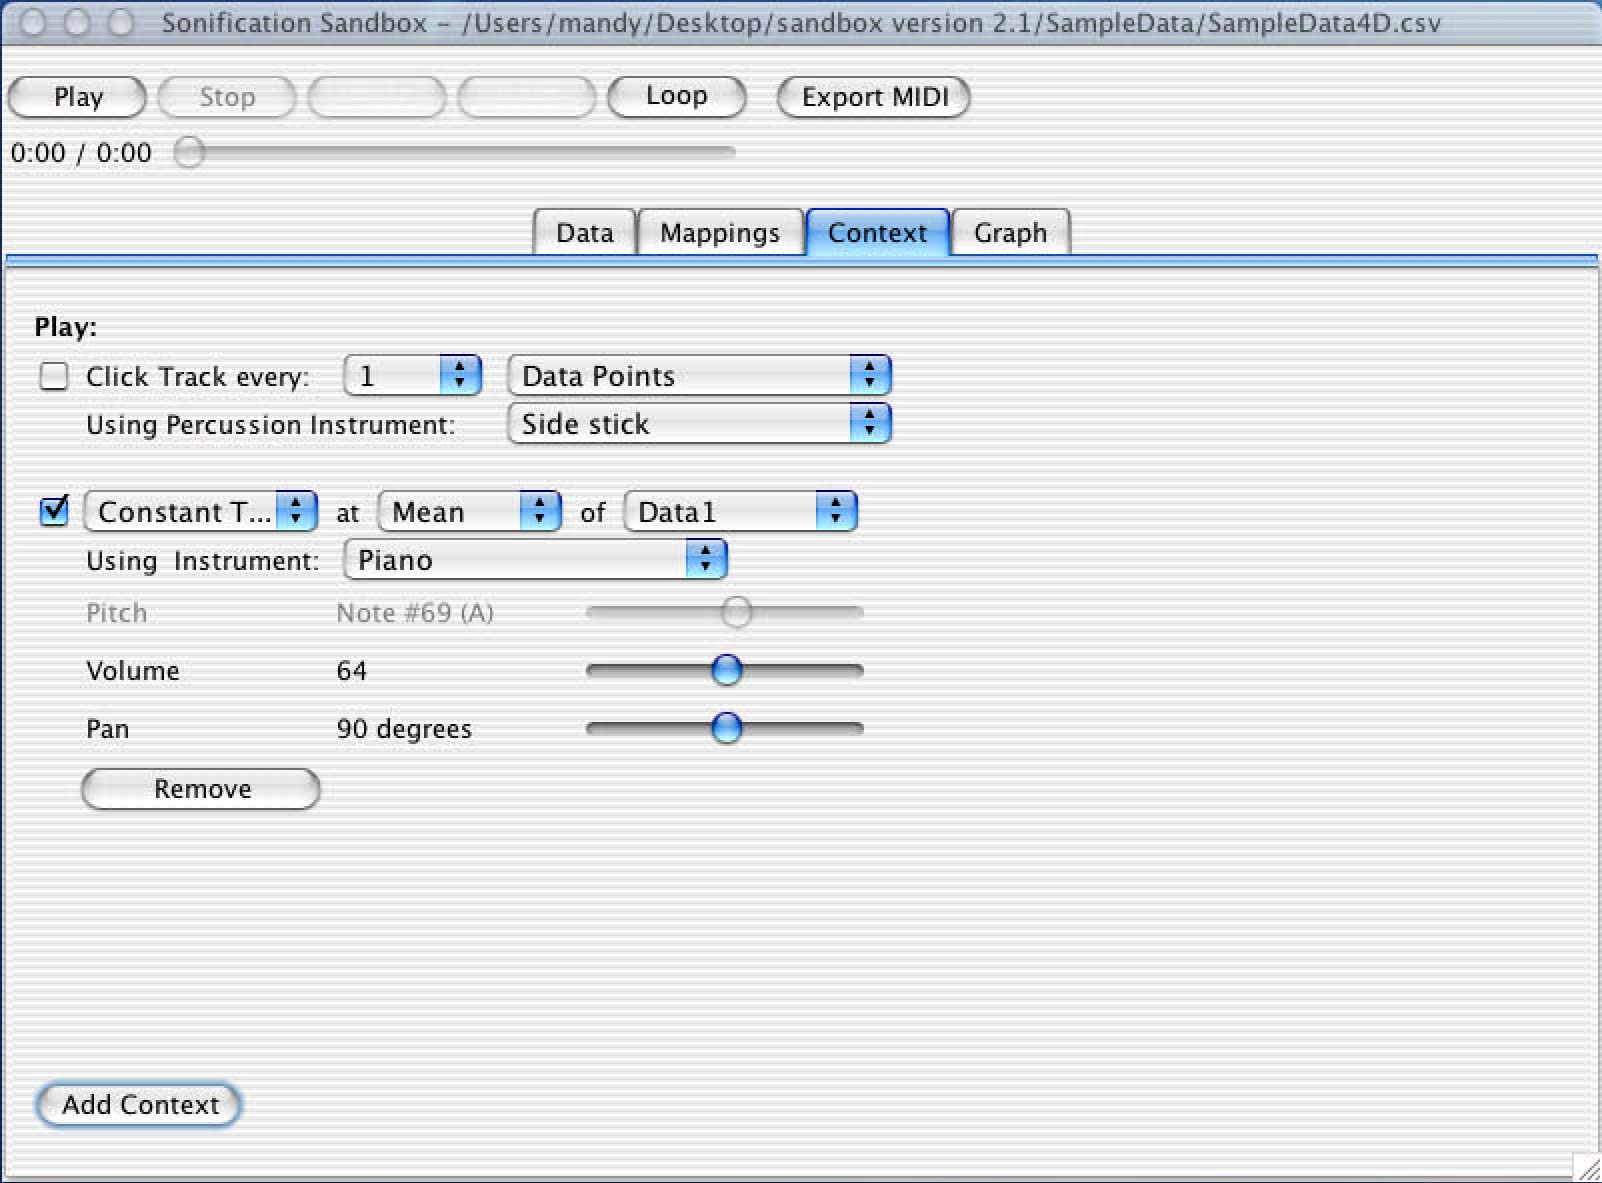
The Context Tab allows the addition of context to auditory graphs in the form of a click track, as well as constant or repeating tones (i.e., notifications), which are analogous to the tick-marks, axes, and labels found in visual graphs. The click track adds a percussive instrument sound every N data points or seconds to assist the listener in following the data. Constant or repeating tones can be played at the mean, min, or max of a data set. Finally, a notification can be played when a data set crosses the mean or reaches the min, max, or an inflection point. For notifications, pitch, volume, and pan can be adjusted as desired.
 |
The Graph Tab shows a visual representation of the data, which can help (sighted) users visualize the data. This allows a whole classroom to use the same tool, and a sighted student could therefore assist a blind user in manipulating the software and in customizing the auditory graph. Note that many functions, including menus and sound playback, respond to voice recognition implemented in cooperation with the IBM ViaVoice package, so a visually impaired user could perform basic actions alone.
Playback for the Sonification Sandbox is provided via a standard Play/Stop/Pause set of buttons, with an interactive progress bar for viewing and adjusting the playback position while the sonification is playing. A toggle Loop button causes the whole graph to loop, and a Hold button causes the sonification to loop on the current one-second section of the auditory graph for more careful listening. An Export button allows the user to save the sonification as a MIDI file.
DISCUSSION
The Sonification Sandbox, especially version 2.1, represents a big step in the right direction for sonification toolkits, and it continues to evolve and improve as new features are added. Several efforts are currently underway to bring the software even closer to the goals that have been established for it. First, we will be adding settings for different kinds of data (e.g. money, weight, velocity, etc.) that will automatically generate mappings to reflect how the population tends to think data should be represented by sounds [6]. Second, features will be added to improve the usability of the software for members of the blind community. In its current implementation, a sighted user would typically need to assist a visually impaired student. To mitigate this, additional keyboard shortcuts and speech input capabilities are being added, and the interface will be augmented to provide more robust support for screen readers such as JAWS and Window-Eyes. Third, a Java spreadsheet application will be integrated into the interface, with improved support for file types, support for equations, enhanced data selection, a sonification wizard, and other improvements. This will allow users to seamlessly transition between data editing and sonification. It will also be possible to save the sonification settings for a set of data out to a project file. Finally, the graph is currently static, but later iterations will include animation (e.g., highlighting the data point currently being played) and interaction (e.g., a data point will be played when the user clicks on it).
CONCLUSIONS
While there have been several excellent sonification toolkits to date, the increasingly widespread use of sonification will continue to rely on broadly usable, platform-independent, and user-friendly tools. Further, these tools need to continue to implement the results from experimental studies in the sonification and auditory display literature. The Sonification Sandbox project represents a step in this evolutionary process, intended to provide a useful way to create auditory graphs and also provide a platform for further research and development.
REFERENCES
- Walker, B.N. and D.M. Lane. Psychophysical scaling of sonification mappings: A comparison of visually impaired and sighted listeners, in Proceedings of the International Conference on Auditory Display . 2001. Espoo, Finland.
- Wilson, C.M. and Lodha, S.K., Listen: A data sonification toolkit, in Proceedings of the International Conference on Auditory Display . 1996. Palo Alto, USA.
- Joseph, A.J. and Lodha, S.K. "MUSART: Musical Audio Transfer Function Real-Time Toolkit," in Proceedings of the International Conference on Auditory Display . 2002. Kyoto, Japan.
- Smith, D. R. and Walker, B.N. Tick-Marks, axes, and labels: The effect of adding context to auditory graphs, in Proceedings of the International Conference on Auditory Display . 2002. Kyoto, Japan.
- Upson, R. "Educational sonification exercises: Pathways for mathematics and musical achievement," in Proceedings of the International Conference on Auditory Display . 2002. Kyoto, Japan.
- Walker, B.N. Magnitude estimation of conceptual data dimensions for use in sonification, Journal of Experiment Psychology: Applied , 8, 2002.
Author Contact Information:
Bruce N. Walker, PhD.,
Georgia Institute of Technology,
654
Cherry Street, N.W.,
Atlanta, GA 30332,
Office Phone (404)
894-8265
EMAIL: bruce.walker@psych.gatech.edu