Design and Development of a Pneumatic Suspension Caster Wheelchair Fork
ABSTRACT
The objective of this project was to research, design, fabricate, test, and update the first pneumatic suspension caster fork to lessen the effects of shock that affect wheelchair users. The pneumatic suspension caster fork is a new innovative way of reducing these stresses experienced from wheelchair travel. This caster uses a radial design so that the two pieces of the caster can work in unison for the desired amount of shock absorption. The caster was designed for absorbing shock in both the vertical and horizontal directions simultaneously. This caster incorporates a pressure gage and a brass air tank valve for easy regulation of the air resistance within the piston casing.
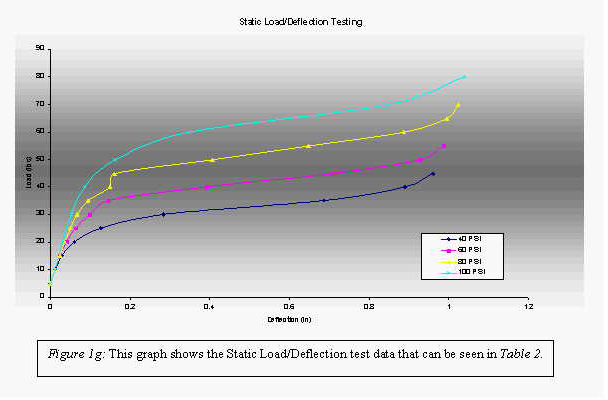
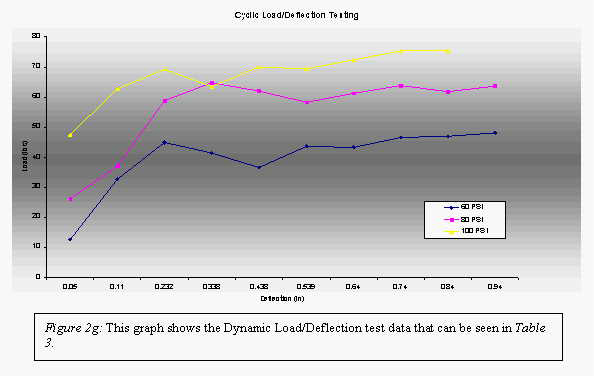
Load deflection testing, both static and dynamic, was conducted at 60, 80, and 100 PSI. After analyzing the data, it was found that the caster initially absorbed the shock almost linearly and then leveled out at greater deflection during the dynamic trials. This same relationship was shown for the static trials as well. The results showed that the prototype was functional and could absorb reasonably high loads.
 |
BACKGROUND
The focus of this project was for active manual wheelchair users. There are four main parts of a manual wheelchair: the rear wheels, front caster wheels, the frame, and the seating system. The problem that researchers are facing is the reduction of shock that can cause further complications for the user. Some secondary complications include excessive pain and spasms. Shock affects both rear and front wheels of a wheelchair. The front caster is a significant contributor to vibration and pitching. This is apparent because the front casters are rigidly attached to the frame of the wheelchair.
As there are many types of chairs, there are many types of casters. There is the standard caster, which consists of a metal or plastic caster fork and a rubber wheel. It attaches to the chair via a bolt and nut. Suspension casters use springs and polyurethane shock absorbers to reduce vibration. The standard caster contributes to excessive pain and spasms as it transmits shock and vibration to the user. However, standard casters are inexpensive and are readily available on most manual wheelchairs. Suspension casters are more expensive as a result of the utilization of additional components and more complex designs.
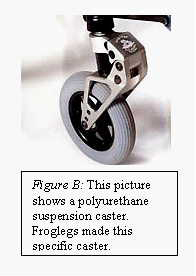 |
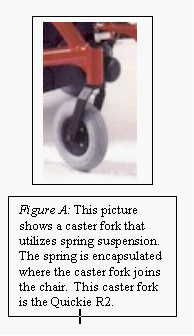
The spring suspension systems that are on casters only prevent shock in the vertical direction, see figure A. The caster forks that use polyurethane has been designed to adsorb the shock in the vertical and horizontal directions, see figure B. The vibration that affects wheelchair users involves forces that are in both the vertical and horizontal directions following a radial pattern. This makes the suspension casters that are on the market today only 70% efficient. (7) Current suspension caster forks that use polyurethane shock absorbers are difficult to tune for each individual user and to changes in the user center of mass within the wheelchair. This results in a wide range of performances for individuals.
RESEARCH QUESTION
 |
Current suspension caster forks are severely limited in their ability to be tuned to the individual, the set-up of the wheelchair (e.g., center of mass location of the wheelchair and user), and the driving scenario (e.g., indoors, outdoor rough surface). The objective of this project was to research, design, fabricate, test, and update a pneumatic suspension caster fork to lessen the effects of shock that affect wheelchair users. The primary benefit to a successful pneumatic suspension caster fork is that it can be easily tuned by adding or releasing air from the system to stiffen or soften the suspension. Through using a simple Schrader style air valve a small hand air pump could be used to add air to the system by the user or an assistant to alter the air pressure to the users preferential value for the activity that he or she is performing.
 |
METHOD
The design required precise geometry to absorb shock in the horizontal and vertical directions simultaneously. To assure accuracy in machining the parts, they were to be drawn in FeatureCam* before machining could take place, the materials of all the parts were to be chosen so that the caster would be lightweight and cost efficient. After the first generation was prototyped, it was to be analyzed and redesigned so that a second prototype could be built. Once the second generation was built, two more units were to be constructed for testing on a manual wheelchair.
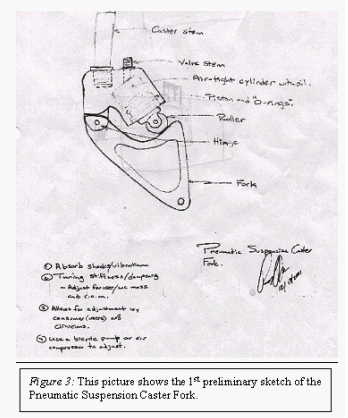
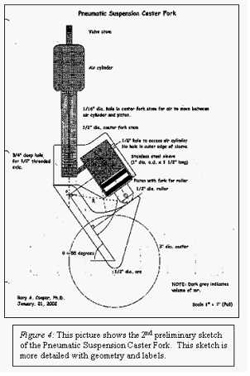
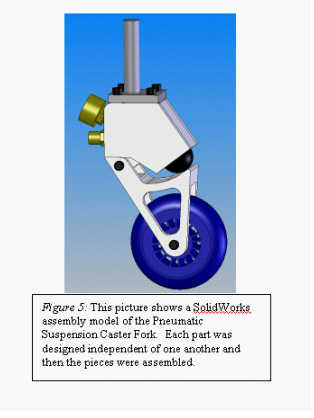
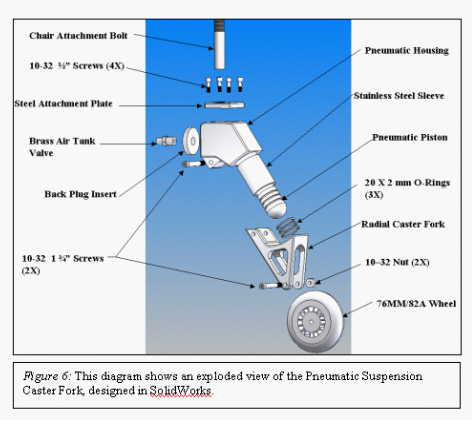
The tests would show that the caster could withstand loads for 3 to 5 years, while not losing air pressure. Tests were also conducted to determine caster deflection when exposed to set loads and cyclic loads. The first sketches of the caster are visible in Figures 3 & 4. From these sketches a model was constructed using computer aided design software (FeatureCam & Solidworks**). An assembly view and exploded view of the pneumatic caster are pictured in Figure 5 & 6 respectively. A conceptual model was designed and the materials that were chosen were organized in a materials table, see Table 1. The material dimensions, features, and solids could be added to write the numerically controlled programs for manufacturing. All of the parts were cut from stock metal and cut to the desired geometry using the following machines: computer numerically controlled and manual mill and lathe, wire electrostatic discharge machine (EDM), band saw, and drill press.
 |
 |
| source | material/Part #/Size | operations | # parts | drawing in file | |
|---|---|---|---|---|---|
| ortho (dimentions) | solid | ||||
| HERL | 1.50" - 6061 Aluminum Plate | Cut, CNC Mill, and Mill | 2 | y | y |
| HERL | 1.0" Delrin Rod | Lathe and Drill | 2 | y | y |
| McMaster | 9464K73 | 6 | na | na | |
| HERL | 1.50" - 6061 Aluminum Rod | Lathe (Taper) | 2 | y | y |
| McMaster | 8063K33 | 2 | na | na | |
| McMaster | 38105K14 | 2 | na | na | |
| HERL | 1.5" - 304 Stainless Steel Rod | Lathe, Drill, Hone | y | y | |
| HERL | 1.50" - 6061 Aluminum Plate | Cut, CNC Mill, and Mill | 2 | y | y |
| Gatto Cycle Shop | 76MM/82A | 2 | na | na | |
| HERL | 10-32 X 1 3/4 | 2 | na | na | |
| HERL | 10-32 lock nut | 2 | na | na | |
| HERL | 0.125" - 1018 Steel Plate | Mill and Drill | 2 | y | y |
| HERL | 0.5-13 Grade 5 Steel Bolt | NA | 2 | na | na |
| McMaster | 4591K11 | 1 | na | na | |
| HERL | Translucent | 1 | na | na | |
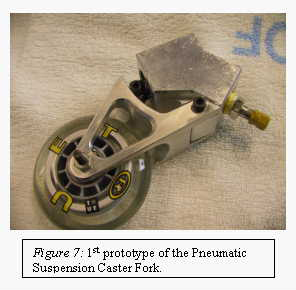 |
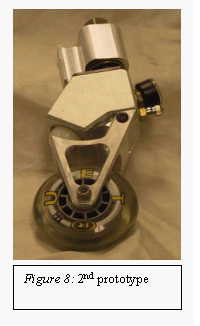
The first functional prototype is pictured in Figure 7. Through brainstorming, it was apparent that some changes needed to be made. The first change is that the first prototype did not have sufficient room to put a bolt to attach to the chair. The solution came by increasing the size of the top caster. Also a steel plate was designed so that the bolt could be welded onto the plate and then screwed into the top of the top portion of the caster fork. The next change that was made was to the piston. The problem with the piston was that the roller did not remain straight after repeated loading. It would turn and dig into the surface of the bottom caster fork. The new material that was chosen was delrin. By switch to Delrin TM and machining the end of the piston into a half sphere, it could slide along the surface of the bottom caster without damaging the aluminum fork that it was in contact with. The second generation was constructed with the newly designed parts and ideas. The second generation can be seen in Figure 8. The second prototype proved to hold air more effectively and could be tested for load deflection.
 |
The method of testing this unit required the use of computer numerically controlled press machine (Instron, model # 8872). The caster fork was bolted to a steel plate that attached to the base of the Instron machine. A hole was drilled in that plate so that the bolt of the caster fork would slide through and be secured by a locknut. The caster was positioned so that the pressure gauge and brass air tank valve were facing up. The w * heel was centered under the load cell. Testing of the pneumatic casters used the same protocol as that described by Blauch et al. (1). The data were compared to the theoretical analysis derived using the Ideal Gas Law
RESULTS
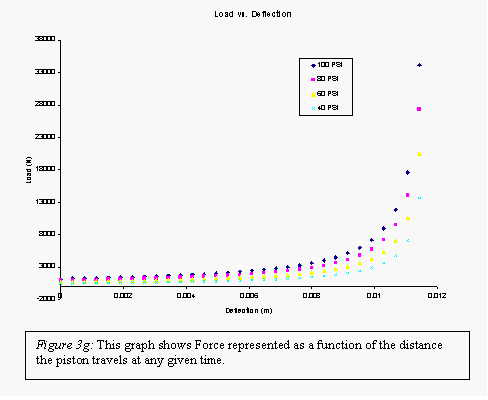
The data recorded from the static load/deflection test are presented on Table 2 and Figure 1. The data recorded from the dynamic load/deflection test are represented in Table 3 and Figure 2. The cyclic load was applied at 1.5 Hz to mimic the loading from an American National Standards Institute (ANSI) and RESNA double-drum fatigue test (3). The deflection and amplitude were measured using linear-variable displacement transformer and a load cell with an oscilloscope. The Ideal Gas Law was used to determine how many moles of air were in the caster for each of the different pressures tested. Using the following equation, derived from the ideal gas law and P=F/A, Force can be represented as a function of the travel of the piston expressed in Equation 1. The graph of the results derived using this equation is shown in Figure 3.
 |
 |
 |
| 40 PSI | ||
|---|---|---|
| Load (lbs) | Low | Deflection (in) |
| 5 | 18 | 0 |
| 10 | 38 | 0.0124 |
| 15 | 62 | 0.0286 |
| 20 | 86 | 0.0603 |
| 25 | 106 | 0.1274 |
| 30 | 126 | 0.2839 |
| 35 | 150 | 0.6859 |
| 40 | 170 | 0.8899 |
| 45 | 190 | 0.9609 |
| 60 PSI | ||
| Load (lbs) | Low | Deflection (in) |
| 5 | 18 | 0 |
| 10 | 42 | 0.0114 |
| 15 | 62 | 0.0249 |
| 20 | 86 | 0.0397 |
| 25 | 106 | 0.0641 |
| 30 | 126 | 0.099 |
| 35 | 150 | 0.1452 |
| 40 | 170 | 0.3936 |
| 45 | 190 | 0.7086 |
| 50 | 214 | 0.9276 |
| 55 | 238 | 0.9886 |
| 80 PSI | ||
| Load (lbs) | Low | Deflection (in) |
| 5 | 18 | 0 |
| 10 | 38 | 0.012 |
| 15 | 62 | 0.0242 |
| 20 | 86 | 0.0359 |
| 25 | 106 | 0.0499 |
| 30 | 126 | 0.0679 |
| 35 | 150 | 0.0959 |
| 40 | 174 | 0.1499 |
| 45 | 190 | 0.1619 |
| 50 | 218 | 0.4069 |
| 55 | 238 | 0.6469 |
| 60 | 258 | 0.8869 |
| 65 | 278 | 0.9949 |
| 70 | 302 | 1.0239 |
| 100 PSI | ||
| Load (lbs) | Low | Deflection (in) |
| 5 | 22 | 0 |
| 10 | 42 | 0.0114 |
| 20 | 82 | 0.0318 |
| 30 | 126 | 0.0533 |
| 40 | 170 | 0.0864 |
| 50 | 218 | 0.1634 |
| 60 | 258 | 0.3494 |
| 70 | 306 | 0.8494 |
| 80 | 346 | 1.0394 |
| 60 PSI | |
|---|---|
| Load (lbs) | Deflection (in) |
| 12.7 | 0.05 |
| 32.73 | 0.11 |
| 45 | 0.232 |
| 41.47 | 0.338 |
| 36.58 | 0.438 |
| 43.62 | 0.539 |
| 43.34 | 0.64 |
| 46.65 | 0.74 |
| 46.92 | 0.84 |
| 48.16 | 0.94 |
| 80 PSI | |
| Load (lbs) | Deflection (in) |
| 26.21 | 0.052 |
| 37.04 | 0.102 |
| 58.8 | 0.202 |
| 64.76 | 0.337 |
| 61.98 | 0.437 |
| 58.2 | 0.539 |
| 61.34 | 0.638 |
| 63.85 | 0.739 |
| 61.8 | 0.839 |
| 63.7 | 0.939 |
| 100 PSI | |
| Load (lbs) | Deflection (in) |
| 47.59 | 0.1 |
| 62.73 | 0.2 |
| 69.31 | 0.3376 |
| 63.5 | 0.438 |
| 69.89 | 0.533 |
| 69.43 | 0.638 |
| 72.33 | 0.739 |
| 75.342 | 0.839 |
| 75.6 | 0.939 |
DISCUSSION
In both the static load and deflection and the dynamic load and deflection tests, the pressure exhibited the desired response. The pressure would increase and decrease under deflection and return with little hysteresis. Pre-loading the chamber with a base pressure greater than of atmospheric pressure controlled for hysteresis. This is ideal for wheelchair users that are traveling over uneven terrain. The caster air chamber cannot be under filled because even when uncharged (i.e., when simply filled with air with zero relative air pressure) there is sufficient pressure built upon during compression of the piston within the chamber to prevent bottoming out. Hence, this prevents the effects of shock from being just as damaging as the shock produced by standard casters.
One explanation of why the data did not follow theory is because the piston required more force to start moving on the radial surface of the bottom portion of the caster fork. The static friction was greater at the start of movement than when the piston was displaced a certain distance on the surface of the caster fork. Another possible error is imperfections in the geometry of sliding surface of the caster fork during fabrication. As the piston follows the machined path, the curvature may be steeper and not at a consistent radius as compared the theoretical. This would consequentially cause the piston to displace unevenly along the radius. This may cause the load to increase more at smaller displacements and less at larger displacements. Also, the model assumed linear displacements at the piston, whereas the data collected on the Instron record linear displacements at the caster. Greater agreement would result if the geometry of the caster fork were accounted for in the displacement curves.
The force that is experienced by the caster wheel when in contact with a solid step is 400 lbf. The moment that the caster fork experiences from the caster wheel impact is 200 lbf-ft.(4) The testing suggested that at the pressures analyzed the highest pound force experienced was 80 lbf. This means that the pneumatic suspension caster fork did not apply enough resistance, via air pressure, to absorb the suggested loads that the caster fork experiences. Therefore, high air pressures may be necessary for heavier individuals who are traveling over rough surfaces. Future testing should include air pressures in the 200-300 PSI range.
REFERENCES
- Blauch C, Cooper RA , Guo S, McCartney M, Wolf E, Dvorznak MJ, Mechanical Properties of Polyurethane Elastomers in an Oblique Angled Suspension Caster Fork for Wheelchairs, 25 th Annual RESNA Conference, Minneapolis, MN, pp. 297-299, 2002.
- VanSickle DP, Cooper RA , Boninger ML, Road Loads Acting on Manual Wheelchairs, IEEE Transactions on Rehabilitation Engineering, Vol. 8, No. 3, pp. 385-393, 2000.
- http://www.vard.org/tts/avail/01-092.htm
- Dwight O. Johnson, MSME, Consultant to Wheeled Mobility Center San Francisco State University San Francisco, California 94132 Simplified Strength Testing of Manual Wheelchairs in Developing Countries.
ACKNOWLEDGMENTS
This project was conducted at the University of Pittsburgh's Human Engineering Research Laboratories under the supervision of Dr. Rory A. Cooper
Jeremy R. Puhlman, BS,
University of Pittsburgh,
Pittsburgh,
PA 15260,
Office Phone (412) 365-4836
EMAIL: jrpst46@pitt.edu