Using Wavelet Analysis to Investigate Skin Blood Flow Control Mechanisms: Implications for Skin Thermoregulatory Mechanisms
ABSTRACT
The usefulness of spectral analysis in examining blood flow control mechanisms has been demonstrated, but traditional Fourier analysis does not provide sufficient resolution to reveal characteristic low frequencies. Time-frequency (wavelet) analysis was performed on ten subjects' sacral skin blood flow responses to heating (45°C). Five frequency bands were identified (0.008-0.02, 0.02-0.05, 0.05-0.15, 0.15-0.4, 0.4-2.0 Hz) corresponding to metabolic, neurogenic, myogenic, respiratory, or cardiac origins. Significant differences were observed in the mean, normalized power of the metabolic and myogenic frequency bands (p<0.01) between baseline and maximal heating and baseline and post-heating periods. Wavelet analysis successfully characterized thermoregulatory control mechanisms by revealing the contributions of the physiological rhythms imbedded in the blood flow signal.
KEYWORDS
Heating, laser Doppler flowmetry, skin blood flow, vasomotion, wavelet analysis.
BACKGROUND
Laser Doppler flowmetry (LDF) has been used extensively to quantify skin perfusion responses to compressive loading. Traditionally, blood flow has been reported only in the time domain. Because the physiological rhythms associated with blood flow control mechanisms are imbedded in the blood flow signal, decomposing the signal via spectral analysis reveals various characteristic frequencies and may contribute to our understanding of these complex control mechanisms. Fourier transform-based power spectrum analysis has revealed two characteristic frequencies: slow-wave (thought to be neurogenic) and fast-wave (thought to be controlled by local mechanisms). However, blood flow is a non-stationary signal and Fourier transform -based analysis does not provide sufficient time resolution for a comprehensive analysis. Morlet first conceptualized wavelet analysis in 1983 to overcome this limitation of the Fourier method (1). We considered that using wavelet analysis with improved resolution may advance the understanding of skin microcirculatory control mechanisms. Such knowledge is important for understanding the effects of pressure and heat when applied to the skin during wheelchair seating.
The vasodilation induced by local heating is primarily mediated by neurogenic reflexes and locally released substances. However, the interactions between these mechanisms are complex and poorly understood (2). To further clarify and objectively characterize these mechanisms, we used wavelet analysis to study blood flow and control mechanisms response to local heat.
RESEARCH QUESTION
This study aimed to: 1) thermally-induce maximal sacral skin blood flow responses, 2) identify the characteristic frequency bands in the blood flow signal using the wavelet analysis and 3) determine the relative contribution of the various bands to the total blood flow. In this manner, the response to thermally induced maximal blood flow could be characterized. Thus, in subsequent studies, the control mechanisms associated with the effects of heating could be differentiated from those associated with tissue loading.
METHODS
Ten unimpaired subjects (5 male and 5 female) were recruited into the study. The demographic data were as follows: age 30.0 ± 3.1 years, height 5'4 ± 3, and weight 128.3 ± 18.9 pounds. The following conditions constituted exclusion criteria: the presence of pressure ulcers on the sacrum, diabetes, vascular disease, hypertension, or use of vasoactive medications.
Laserflo Blood Perfusion Monitor 2 (Vasamedics, MN) and Softip pencil probe (P-435) were used to measure capillary blood perfusion (ml LD /min/100g tissue). A temperature control module (TCO, Vasamedics, MN) was used to heat the skin to 45°C to obtain a maximal skin blood flow response. A computer-controlled indenter system was developed for use in this study and is described elsewhere (3).
With subjects lying prone on a customized, conforming support surface, blood flow over the sacrum was recorded at rest for 10 minutes to establish baseline flow. Fifteen minutes of incremental heating (from 35 to 45°C) followed. Skin blood flow monitoring continued throughout a 10-minute recovery period. Room temperature was maintained at 75 ± 2°F.
Wavelet analysis provides a multi-resolution, time-frequency analysis of sacral skin blood flow. Continuous wavelet transform of a signal f(t) is defined as (1):
![]()
where (u,s) is a wavelet coefficient and ψu,s(t) is a wavelet function and is defined as
A family of time-frequency wavelets are obtained by scaling ψ by s (scale factor) and translating it by u (time factor). The Morlet wavelet model was used to perform wavelet analysis. All mathematical algorithms were developed using Matlab 5.2 (MathWorks, MA).
 |
|---|
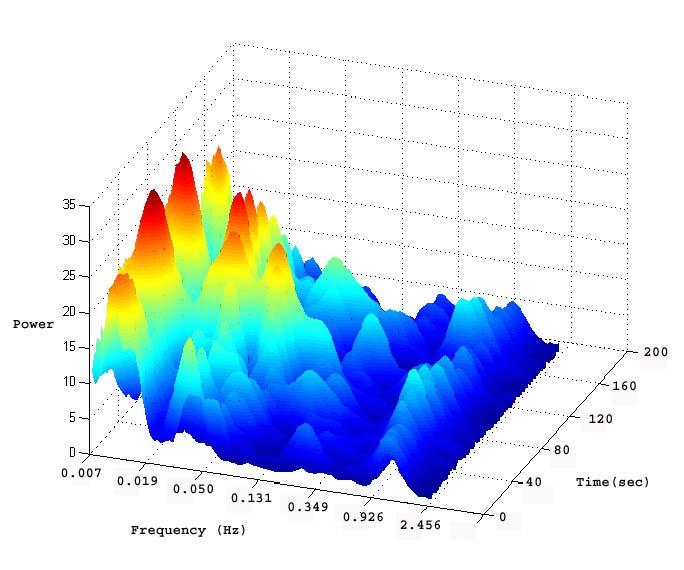
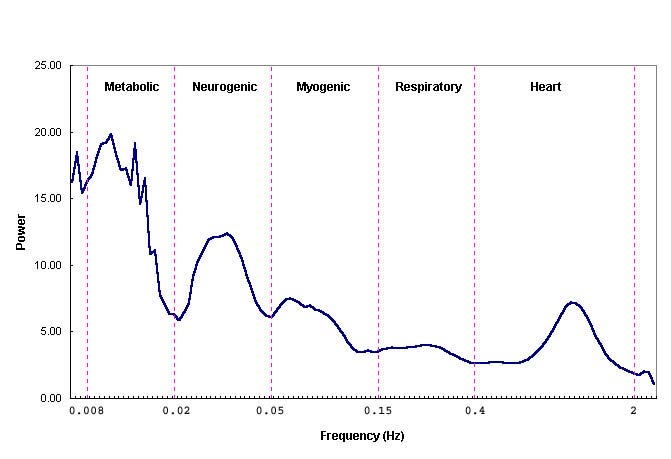
The wavelet transforms are expressed in the time-frequency domain (Figure 1). In this form, the data cannot be easily compared or quantified. However, by averaging the data points in the time domain during a specific time period, two-dimensional time and frequency data may be reduced to one-dimensional frequency domain data (Figure 2). In order to compensate for variability in total flow, the power for each frequency band was normalized to the total energy for each condition.
A one-way ANOVA with repeated measures was used to compare differences among baseline, heating, and recovery periods. The level of significance for post-hoc multiple comparisons of repeated measures was adjusted to 0.017 based on the Bonferroni correction.
 |
|---|
RESULTS
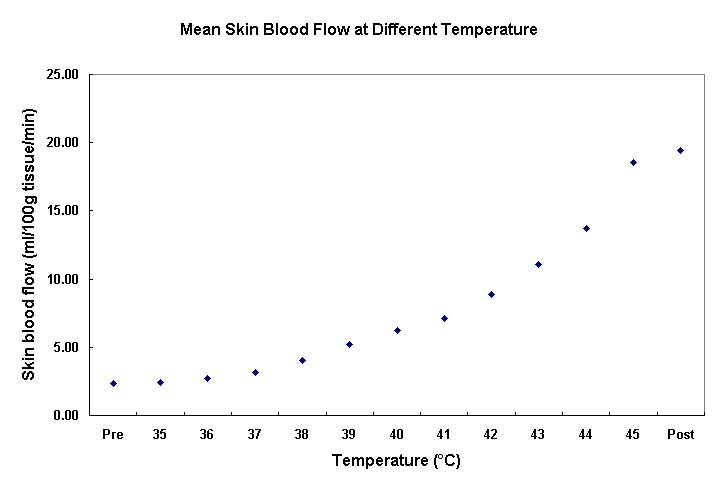
The mean blood flow for each temperature was plotted and is shown in Figure 3. Group mean blood flow increased in response to heating from 35°C to 45°C.
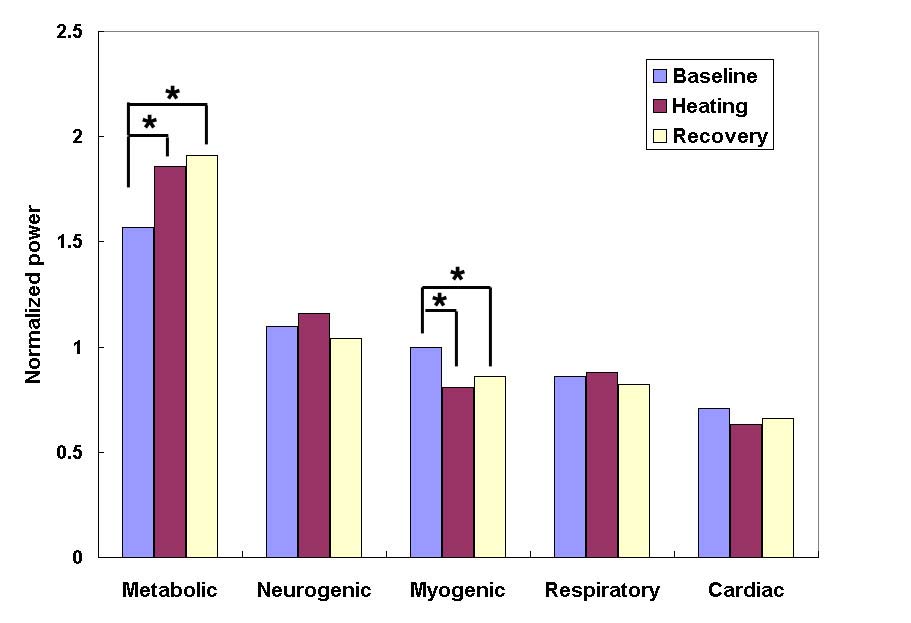
Analysis using one-way ANOVA with repeated measures demonstrated a significant difference between the mean metabolic and myogenic frequency bands for all conditions. Following post-hoc analysis; however, statistically significant differences were demonstrated only between 1) the mean baseline and 45°C heating period and 2) the baseline and recovery period for the metabolic and myogenic frequency bands. The relative contribution in the metabolic frequency band was increased (p<0.01) while the myogenic frequency band decreased (p<0.01) (Figure 4).
 |
|---|
DISCUSSION
The increased metabolic influence was anticipated and may be explained by the increase in metabolic activity associated with tissue heating. Higher ambient temperatures have been shown to cause an increase in tissue metabolism and oxygen consumption on the order of 10% for every 1 ° C (4).
Local myogenic control is considered to be independent of any neural or humoral influences and has been associated with the application of mechanical force to the vascular smooth muscle cell (5). In this study, thermal stress was applied with minimal mechanical force and deformation to the soft tissue. Therefore, compared to baseline blood flow, heat stress accounts for the observed decreased power in the myogenic frequency band shown in the heating and post-heating periods.
 |
|---|
Based on the distribution of power, five frequency bands were identified to represent the frequency elements embedded in the blood flow signal. The five frequency bands were designated as 1) metabolic (0.008-0.02 Hz), 2) neurogenic (0.02-0.05 Hz), 3) myogenic (0.05-0.15 Hz), 4) respiratory (0.15-0.4 Hz), and 5) cardiac (0.4- 2.0 Hz) (Figure 3). Direct and indirect evidence supports the designation of the frequency bands' origins. The evidence supporting assignment of the lower frequencies to metabolic, neurogenic or myogenic origins is primarily based on the previous research (6; 7). Although designation of the frequency bands is based solely on the data obtained from 10 subjects, we believe this method will prove useful in determining the relative significance of the various control mechanisms of skin blood flow in response to loading or other stimuli.
Our long-term goal is to improve our understanding of the control mechanisms of blood flow associated with tissue loading in order to optimize critical parameters that enhance tissue viability. Through wavelet analysis of the LDF skin blood flow signal, our study identified five frequency bands. Our findings indicate that the relative contribution in the metabolic frequency band was increased while the myogenic frequency band decreased. Thus, our study has established a means of evaluating the relative influence of specific control mechanisms in response to local heating. Using this method it will be possible to differentiate heating effects from loading (pressure) effects in future studies.
REFERENCES
- Grossmann, A., & Morlet, J. (1984). Decomposition of Hardy functions into square integrable wavelets of constant shape. SIAM J Math Anal, 15 (4), 723-736.
- Kellogg, D. L., Jr., Liu, Y., Kosiba, I. F., & O'Donnell, D. (1999). Role of nitric oxide in the vascular effects of local warming of the skin in humans. Journal of Applied Physiology, 86 (4), 1185-1190.
- Jan, Y. K., Geyer, M. J., & Brienza, D. M. (2003). Development of a system to study the effect of alternating pressure loading on skin perfusion. Paper presented at the RESNA International Conference, Atlanta, GA.
- Brown, A., & Brengelmann, G. (1965). Energy metabolism. In T. C. Ruch & H. D. Patton (Eds.), Physiology and biophysics (19 ed., pp. 1030-1079). Philadelphia: Saunders.
- Meininger, G. A., & Davis, M. J. (1992). Cellular mechanisms involved in the vascular myogenic response. American Journal of Physiology, 263 (3 Pt 2), H647-659.
- Stefanovska, A., & Bracic, M. (1999). Physics of the human cardiovascular system. Contemporary Physics, 40 (1), 31-55.
- Soderstrom, T., Stefanovska, A., Veber, M., & Svensson, H. (2003). Involvement of sympathetic nerve activity in skin blood flow oscillations in humans. American Journal of Physiology - Heart & Circulatory Physiology, 284 (5), H1638-1646.
Yih-Kuen Jan, MS, PT;
Forbes Tower, Suite 5044,
University of Pittsburgh,
Pittsburgh, PA 15260;
Phone: (412) 383-6583;
Email: yij2@pitt.edu