29th Annual RESNA Conference Proceedings
Measurement Validity for Compass Assessment Software
Heidi Horstmann Koester, Edmund F. LoPresti, Koester Performance Research; Richard C. Simpson, University of Pittsburgh
ABSTRACT
Compass software for access assessment includes eight skill tests. Each test records speed and accuracy data and also counts occurrences of particular events during test performance. To determine the validity of these measurements, we compared data on Compass reports to a video benchmark. Compass timing measurements matched the video logs to within an average of -0.014 seconds, and Compass' event counts matched the video exactly. We conclude that Compass has the measurement validity necessary to be used with confidence for clinical decision-making.
Keywords:
assessment, outcomes measurement, computer access, validity
BACKGROUND
Compass software allows an evaluator to assess an individual's computer input skills. This assessment tool can help diagnose difficulties with an existing interface; evaluate and compare the expected performance with potential access systems; plan training interventions; track changes in a client's abilities over time; and measure the effectiveness of an intervention [1].
The current version of Compass includes eight skill tests in three input device domains. Each test is configurable to match it properly to the client's needs. For example, the size and color of text and objects can be adjusted if necessary. These configurations are saved, allowing for efficient re-use in a subsequent session if desired. During a test run, data regarding the speed and accuracy of user actions are recorded. Following the test, Compass can generate a report, summarizing results for the test and providing trial-by-trial detail if desired. Table 1 summarizes the available Compass tests.
| Domain | Test Name | Major Skill(s) Tested | Performance Data |
| Pointing Devices | Aim | Move mouse pointer into a target Click (or dwell) to select target | % Error-free trials Total time Reaction time Cursor entries Clicks |
| Drag | Move mouse pointer into a target Click (or dwell) to select target Drag target to a destination Release target | % Error-free trials Total time Click errors Drag attempts | |
| Menu | Select a specific item from a menubar | % Error-free trials Total time Errors | |
| Text Entry | Letter | Enter a specific letter | % Error-free trials Total time Key Press time Key Release time |
| Word | Enter a specific word | % Error-free trials Total time Typing speed % Errors per word | |
| Sentence | Enter a specific sentence | % Error-free trials Total time Typing speed % Errors per sentence | |
| Switch Use | Switch Press | Press and release a switch | % Error-free trials Total time Switch Press time Switch Release time |
| Scan | Select a specified letter using a row-column scan matrix | % Error-free trials Total time % Timing Errors |
RESEARCH GOALS
The primary purpose of Compass is to provide sound quantitative evidence on which to base clinical decisions. To fulfill this purpose, it is essential that the measures provided by Compass are correct. The goal of this work is to determine the accuracy of Compass' measurements.
METHODS
Overview
To validate Compass' measurements, we compared the data reported by Compass to benchmark data with a known high level of accuracy. Each Compass test consists of a series of trials; e.g., for the Aim test, a series of individual target trials are presented. We compared Compass data for each trial to the video record for that same trial. This provides a more stringent test of measurement validity than examining data averaged across trials, since positive and negative errors for each trial can counteract each other, resulting in a lower measurement error for the trial average.
Compass Data Set
A single individual, who is a member of the research team, performed each of the Compass tests at least once to generate a complete sample of speed and accuracy data. A member of the research team was used in order to ensure that the sample included all types of error actions recorded by Compass.
Digital Video Benchmark
During the performance of the eight skill tests for the Compass data set, the computer screen was videotaped using a digital video camera. The video represents a timestamped record of everything that occurred during test performance. Digital video timing is accurate to within plus- or minus- 1 video frame, or 1/30 of a second.
Processing of Digital Video
The video record was downloaded into iMovie, a program which runs on the Apple Macintosh. Using iMovie, the video was reviewed frame-by-frame for the time and occurrence of particular events. The specific events were defined as follows:
- Trial Start: the first frame in which the trial stimulus was clearly visible. For example, in the Aim test, the trial stimulus is a target to be acquired by the user. The frame in which that target first appeared in the video record was taken as the start of the trial.
- Trial End: this was defined for each test based on Compass' definition of when a trial ends. For the Aim, Drag, Menu, Word, Sentence, and Switch tests, the trial ends on the first frame where the trial stimulus begins to disappear. For the Letter and Scan tests, a trial ends when the letter selected by the user first appears in the appropriate text field.
- Within-Trial Actions: most Compass tests record component actions that occur during a trial, such as the number of times the mouse cursor enters the target in an Aim test. These actions were observable in the video record and tallied for each trial.
Trial durations in video frames were determined by subtracting the start frame from the end frame. The durations were converted to seconds by multiplying the frames by 30. The result was a log for each Compass test representing the time of each event observed on the video. This formed the benchmark for comparisons to the data presented in the Compass reports. A summer intern, who is not a member of the Compass development team, processed the video based on the event definitions.
Comparison of Video Benchmarks to Compass Reports
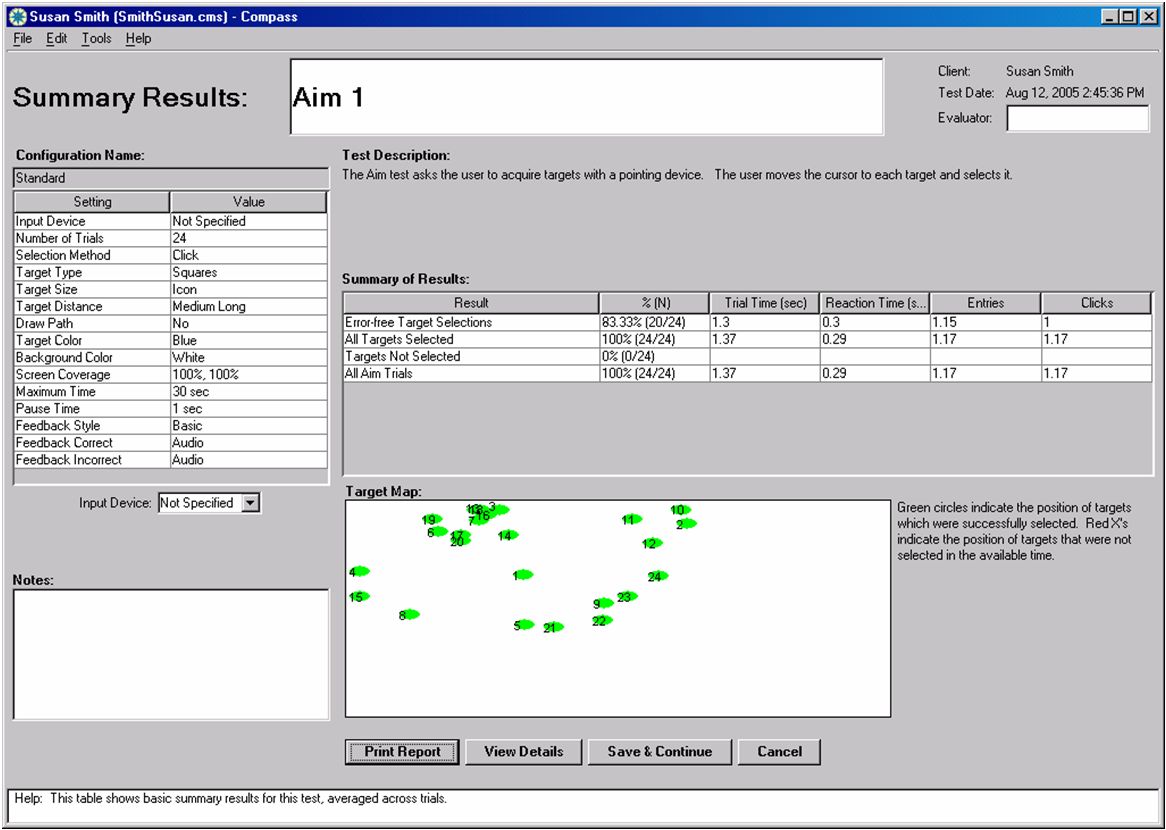 Figure 1. The Summary report for the Compass Aim test. The table labeled "Summary of Results" was validated against a video benchmark. (Click image for larger view)
The report for each Compass test presents speed and accuracy data for each trial within the test, as well as averages across trials. Figures 1 and 2 show the summary and detailed report that Compass presents for the Aim test. Reports for the other tests have the same format, but with slightly different speed and accuracy data (as listed in Table 1).
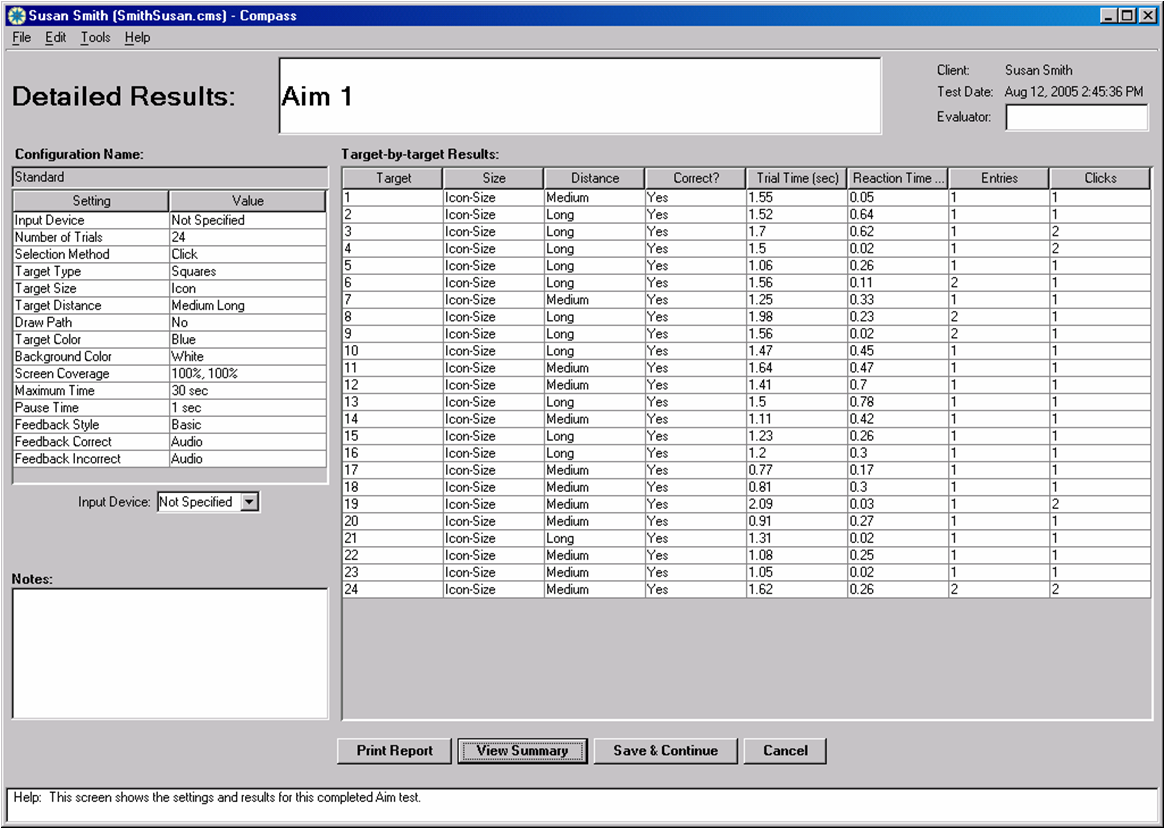 Figure 2. The Detailed report for the Compass Aim test. The table labeled "Target-by-target Results" was validated against a video benchmark. (Click image for larger view)
Each item on the summary and detailed reports was compared to its matching item on the video log. Timing parameters that govern test presentation, including dwell time for the pointing device tests, scan rate for the Scan test, as well as the maximum time per trial and pause time between trials for all tests, were also validated with respect to the video benchmark. The accuracy of the Compass data was calculated as: ((value from video log) - (value on Compass report)).
Criteria for Measurement Validity
Because the video camera takes 30 frames per second, each timestamped event is accurate to within 1/30 of a second. Elapsed times on the video log are calculated as the difference between two timestamped events. This means that elapsed times from the video may differ from the "true time" by as much as 1/15 of a second. Therefore, time measurements reported by Compass were judged accurate if they were within 1/15 (0.07) seconds of the video log time. For tallies of particular event occurrences, our standard was that Compass match the video log exactly.
RESULTS
Table 2 shows the differences between Compass and video data for the Trial Time variable, which is the main measure of speed used in all Compass tests. Trial Time measurements for each of the 8 skill tests were well within the 0.07 second criterion for accuracy, with the average Compass-video difference being -0.014 seconds. The largest discrepancy for a trial in all 8 tests was -0.07 seconds.
The accuracy of Compass timing parameters was also high, as shown in Table 3. These represent the timing aspects of each test that are adjustable, such as the rate of scanning in the Scan test. All of the timing parameters met the criterion of being within 0.07 seconds of the video log time.
Finally, Table 4 shows that Compass exactly matched the video log when tallying specific events, such as extra mouse clicks during target acquisition, misspelled words, or number of menus selected on the way to selecting a particular menu item. This meets our defined standard, and provides assurance that Compass is correctly capturing the events that it claims to be capturing.
| Test | Error in Trial Time (seconds) | ||
|---|---|---|---|
| Max | Min | Avg. | |
| Aim | -0.07 | 0 | -0.016 |
| Drag | -0.06 | 0 | -0.006 |
| Menu | -0.05 | 0 | -0.035 |
| Letter | -0.05 | 0 | 0.003 |
| Word | -0.04 | 0 | -0.002 |
| Sentence | -0.05 | 0 | -0.001 |
| Switch | -0.06 | 0 | -0.024 |
| Scan | -0.05 | -0.02 | -0.033 |
| All Tests | -0.054 | -0.003 | -0.014 |
| Test | Parameter | Error in Timing Parameter (seconds) | ||
|---|---|---|---|---|
| Max | Min | Avg. | ||
| Aim, Drag | Dwell Time | 0.03 |
0 |
0.024 |
| Scan | Scan Rate | 0.03 |
0 |
0.003 |
| Switch | Hold Time | 0 |
0 |
0 |
| All | Max Time | 0 |
0 |
0 |
| All | Pause Time | 0.06 |
0 |
0.014 |
| Test | Event | Discrepancy | ||
|---|---|---|---|---|
| Max | Min | Avg. | ||
| Aim | Entries | 0 | 0 | 0 |
| Clicks | 0 | 0 | 0 | |
| Drag | Click Errors | 0 | 0 | 0 |
| Drag Attempts | 0 | 0 | 0 | |
| Menu | Correct Menus | 0 | 0 | 0 |
| Incorrect Menus | 0 | 0 | 0 | |
| Letter, Word, Sentence | Text Errors (total) | 0 | 0 | 0 |
| Text Errors (net) | 0 | 0 | 0 | |
| Scan | Timing Errors | 0 | 0 | 0 |
DISCUSSION
The high degree of measurement accuracy means that users can trust the data provided by Compass. Users can also trust Compass' test configuration; for example, when they set the scan rate to 2.3 seconds, they can be confident that it is actually scanning at 2.3 seconds.
Doing this sort of validity assessment can be tedious, but is absolutely necessary for any measurement tool. We performed video validation twice earlier in the project, and did find a small number of measurement errors. For example, in a pre-release version of Compass, the first trial of the Aim test had a subtle but significant timing error. Additionally, the counts for click errors in the Drag test were inflated. It was straightforward to fix these errors, but they probably would not have been detected in the first place without the video validation process. While time-consuming, the process is fairly simple, and provides clear assurance of Compass' measurement validity.
REFERENCES
- Ashlock G, Koester H, LoPresti E, McMillan W, Simpson R. (2003). User-centered Design of Software for Assessing Computer Usage Skills. 26 th Annual Conference on Rehabilitation Engineering (RESNA) , Atlanta, GA.
- LoPresti E., Koester H., and McMillan W. (2002). Tools for Assessing Computer Access Skills. Proceedings of ASSETS 2002 , New York: ACM.
ACKNOWLEDGMENTS
This work was funded by the National Institutes of Health, grant #1R42-NS36252-01, as an STTR award to Koester Performance Research. Thanks to Alistair Hayden for creating the video logs.
Heidi Koester, Ph.D.
Koester Performance Research
Ann Arbor MI 48105
hhk@kpronline.com
This should be in the right column.